Introduction to QLog
QLog is highly versatile; it is equipped to train models using historical well log data such as EDR (electronic drilling recorder), LWD, and MWD data to produce synthetic logs. Beyond log generation, QLog offers capabilities for deriving additional results and services, such as calculating rock properties. The software’s advanced modeling capabilities allow users to train neural networks and deep learning models with any structured dataset to predict desired outputs.
The software interface is designed for intuitive navigation, with a landing page that provides access to the main sections: Dashboard, Data Management, and Account Management. The Dashboard presents a snapshot of the user's workflows, including simulation runs and training runs. Through this interface, new workflows can be created, and existing ones can be managed. Meanwhile, the Data Management section facilitates the upload, creation, download, and deletion of data, organized in a familiar file system structure to streamline workflow integration. In Account Management, users can administrate organization access, create new users, and customize their experience with options like theme adjustments and session management.
Main Tabs
Workflow Dashboard
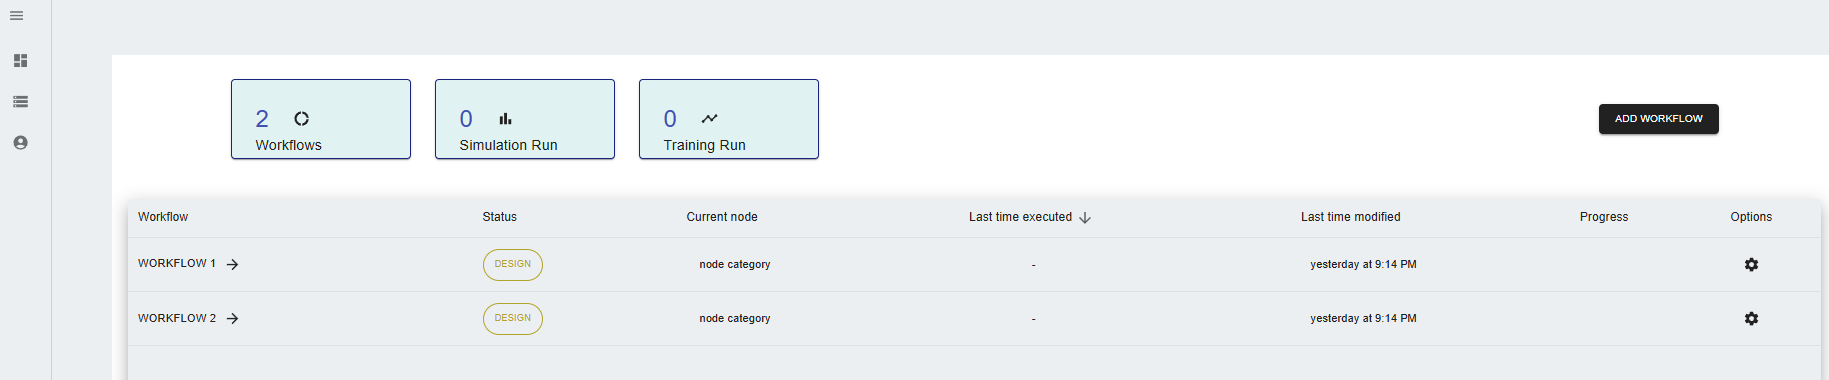
The QLog dashboard provides an overview of workflows, simulation runs, and training runs.
- Open the QLog application.
- Navigate to the Dashboard option in the left menu.
- Observe workflows and metrics such as the number of completed workflows and simulations.
Data Management
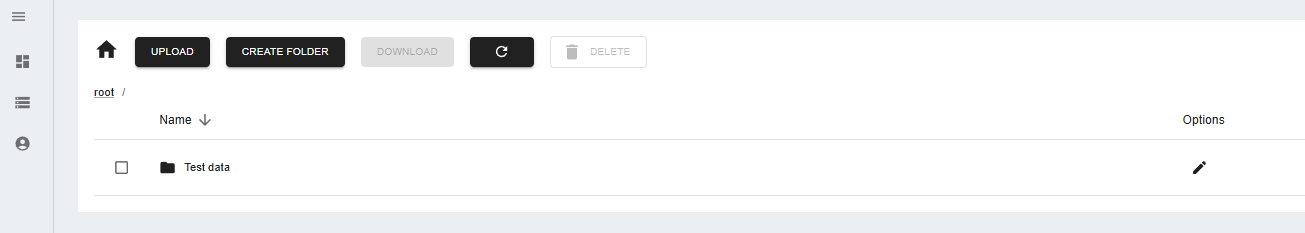
Data management in QLog allows users to upload, create, download, and delete data crucial for synthetic log generation.
- Go to the Data Management section in the left menu.
- Perform actions using the following options:
- Upload: Add new data files.
- Create Folder: Organize your data into folders.
- Download: Save data to your local system.
- Delete: Remove unwanted data files.
Account Management
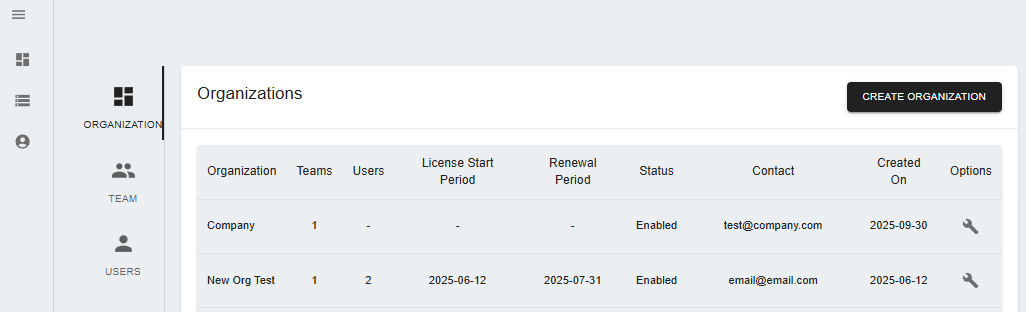
The account management feature lets users manage organizational settings, including user roles and permissions.
- Click on Account Management in the left menu.
- You can:
- Create Organization: Available to Admin or Super Admin users.
- Create Team: Form teams within the organization.
- Add Users: Manage user roles like Admin, Super Admin, or regular user accounts.
Workflow nodes
The nodes in QLog are the building blocks of workflows. Each node serves a specific purpose, allowing users to customize their data processing and analysis. The nodes can be found in the Workflow tab, where users can drag and drop them into their workflow. The nodes are categorized into different sections based on their functionality. The main categories include: - Data Processing: Nodes for data manipulation and preparation. - QLog: Nodes for AI model training and prediction.
Data Processing
Data Consolidation
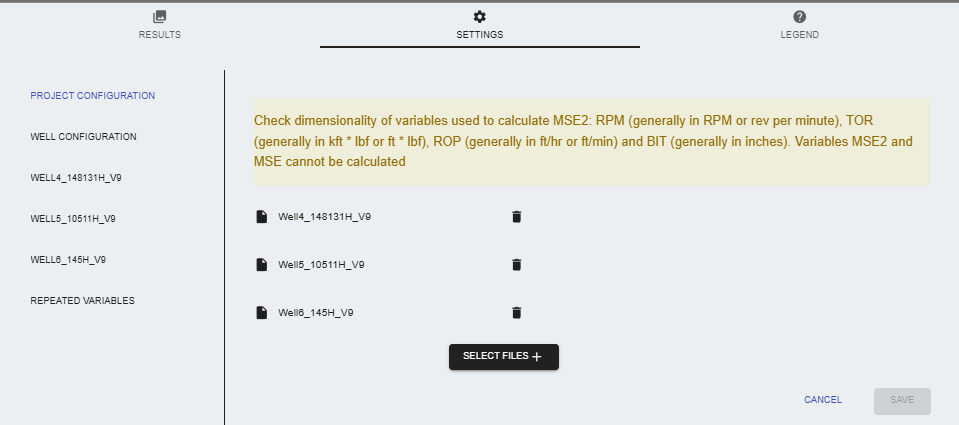
The data consolidation node is essential for combining various types of files and data associated with well projects. This node can be found in the Data Processing tab under QLog Nodes.
Settings
-
PROJECT CONFIGURATION: Choose files to consolidate from the data management section.
-
WELL CONFIGURATION:
-
Default Values for Data Consolidation:
- Minimum Depth Value: Set the minimum depth for the well data.
- Maximum Depth Value: Set the maximum depth for the well data.
- Depth Spacing: Default is set to 0.5, which determines the spacing between depth intervals.
- Select the default method to interpolate missing values: Choose how to handle missing data:
- Interpolate All Values: Fills in all gaps in the data.
- Use Minimum Gap Value: Only fills gaps larger than a specified minimum (default is 3).
- Do Not Interpolate: Leaves gaps as they are.
- Default for minimum gap for interpolation: Set the minimum gap value for interpolation, default is 3.
- Height of Vertical Plot: Adjusts the height of the vertical plot in the results.
- Apply default minimum and maximum values for all variables: This option applies the default min/max values to all variables in the dataset.
- Use default Minimum and Maximum values for all variables: Disable/enable this option to apply the default minimum and maximum values for all variables in the dataset.
- Automatic conversion of mnemonics: Converts mnemonics to standardized versions.
- Enable conversion of units: Converts units within the data.
-
TOP Table:
- Create Formation Tops Table: Users can define TOPS manually to include in the consolidated file. Provide the name for the TOP and the depth value for the TOP.
-
BIT Table:
- Create Bit Size Records: Includes bit size data in the consolidated file.
-
-
INDIVIDUAL FILE SETTINGS:
- Select depth variable: Specify which column contains depth information.
- Select units for depth variable: Choose the units for the depth variable (e.g., meters, feet).
- Type custom Unit: Provide a custom unit that will be verified.
- Choose variables for processing: Select which variables to include in the consolidated file.
- Select all variables: Enable/disable inclusion of all variables from the selected files.
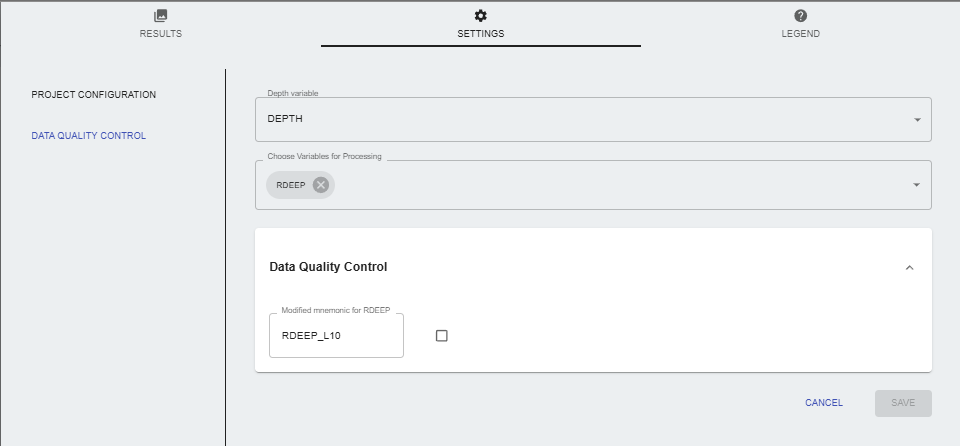
- Data Management options: Modify the mnemonic, units and set the minimum and maximum values for each variable.
- Data quality control: Plot variables to visualize data quality and identify any issues.
- Repeated variables: In the case of repeated variables among the selected files, the node will allow users to select which variable to keep in the consolidated file.
Results
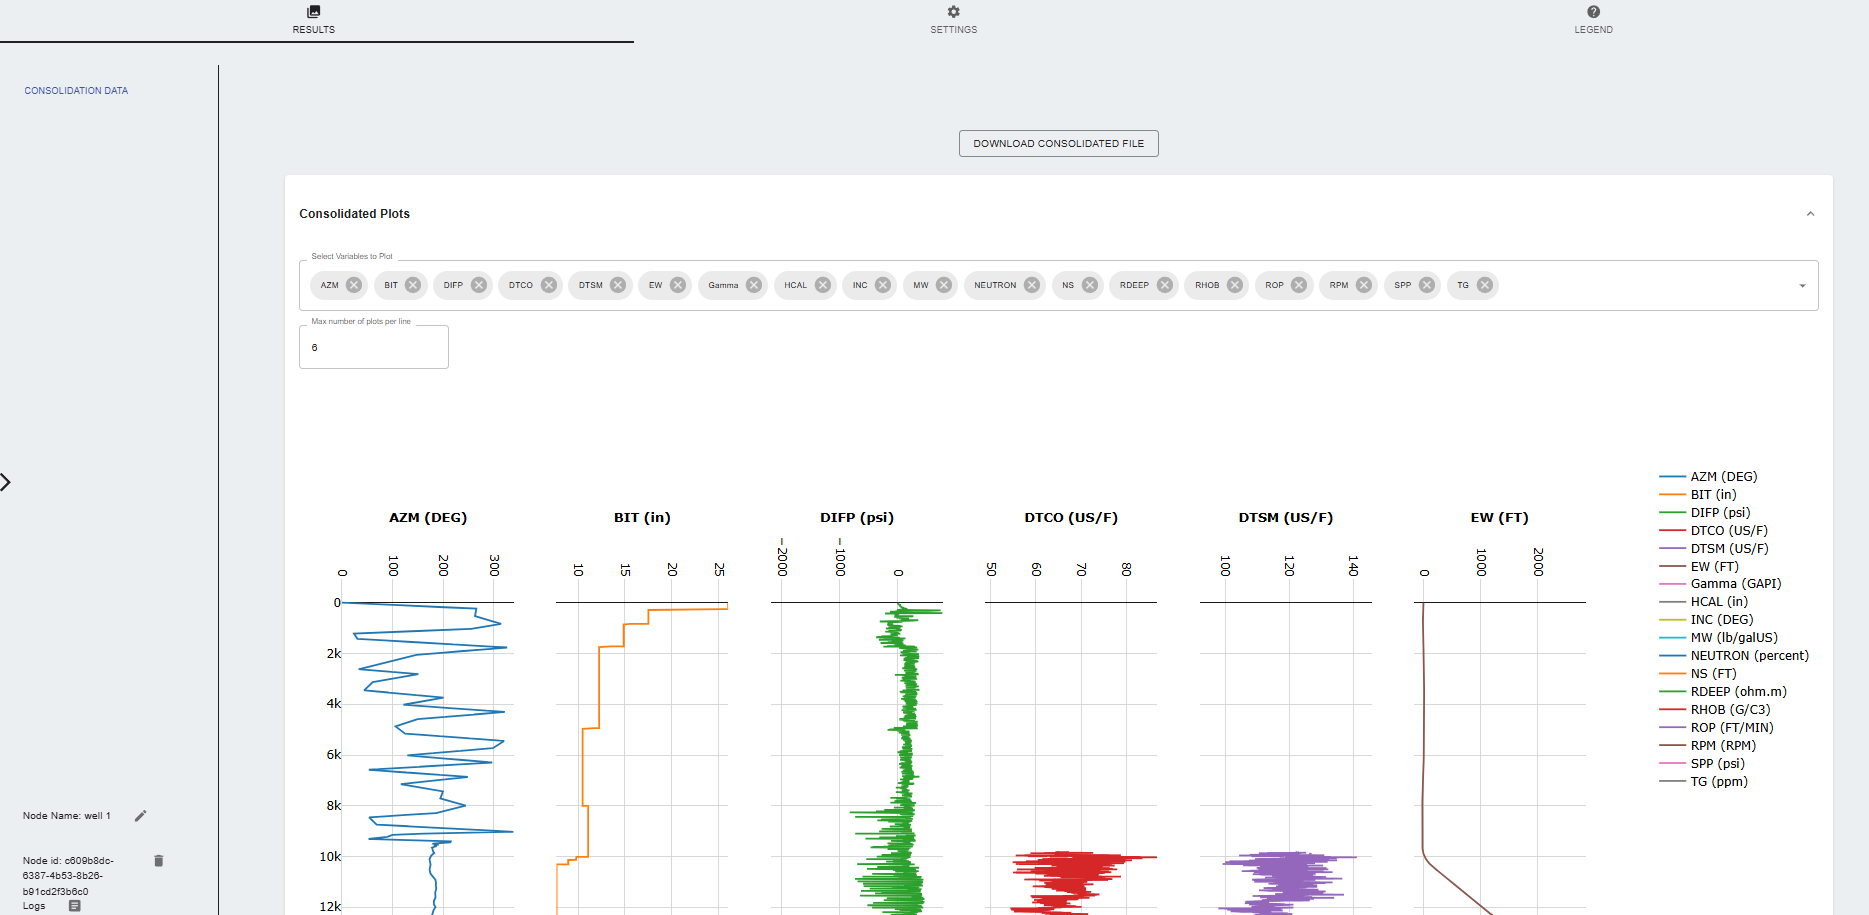
- Consolidated Data: The node generates a consolidated file that includes all selected variables, depth information, and any additional data specified in the settings.
- Download Consolidated File: Users can download the consolidated file in CSV format.
- Data Quality Control: The node provides a plot of the consolidated data, allowing users to visually inspect the quality of the data and identify any issues.
Legend
- Inputs Nodes: Time to Depth
- Output Nodes: Log 10 conversion, Vp/Vs Data QC, Density Data QC, Slide Analysis, Model Training, Property Prediction
Log 10 Conversion
Settings
- PROJECT CONFIGURATION: Data consolidation node is required to be run before this node and connected as an input to this node. The consolidated file will be available as input for the log 10 conversion.
- Data Quality Control:
- Depth Variable: Select the depth variable from the consolidated file.
- Choose variables for processing: Select the variables to be converted to log 10.
- Data Quality Control: Plot the variables to visualize data quality and modify the mnemonic if necessary.
Results
- Log10 Conversion Results: The updated consolidated file with the selected variables converted to log 10 is available for download.
Legend
- Inputs Nodes: Data Consolidation, Slide Analysis, Vp/Vs Data QC, Density Data QC
- Output Nodes: Slide Analysis, Vp/Vs Data QC, Density Data QC, Model Training, Property Prediction
Time to Depth
Settings
- PROJECT CONFIGURATION: Choose a file to convert from the data management section.
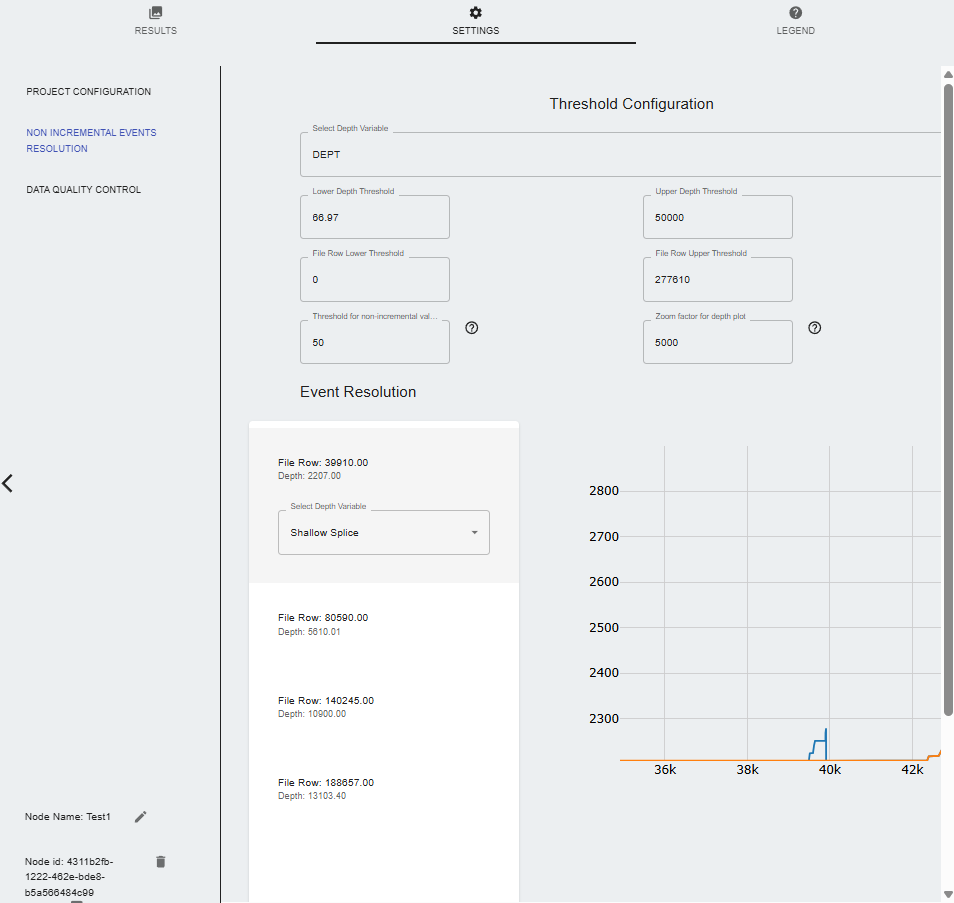
- Non Incremental Events Resolution:
- Select Depth Variable: Choose the depth variable from the file.
- Lower Depth threshold: Set the lower depth threshold.
- Upper Depth threshold: Set the upper depth threshold.
- File Row lower Threshold: Set the file row lower threshold.
- File Row Upper Threshold: Set the file row upper threshold.
- Threshold for non-incremental events: This threshold defines the maximum the amount of continuous samples with non-incremental values that will be tolerated in the time to depth data conditioning. The default of 50 ignores some of the neglible events and users have the option to adjust the tolerance by increasing or decreasing the threshold value. Lower values will tend to increase the number of events that must be resolved.
- Zoom factor for the plot: Adjusts the zoom level of the plot.
- Events Resolution: Depending on the threshold value, the user can cycle through the events that need to be resolved. The options are:
- Shallow splice: Chooses the shallowest depth value to resolve the event.
- Deep splice: Chooses the deepest depth value to resolve the event.
- No action: Does not resolve the event.
- Data Quality Control:
- Time indexed log visualizations: Plot the time-indexed logs to visualize the data quality. Users can choose all variables or specific ones to plot.
- Select variables to process: Select the variables to be processed in the time to depth conversion. Users can modify the mnemonics or units of any variable if necessary.
- Data Availability table: Displays statistics of the data availability for each variable, including the number of samples, minimum and maximum values, and the percentage of missing data.
Results
- Time to Depth Conversion Results: The node generates a file with the time-indexed logs converted to depth-indexed logs. The file includes the selected variables and their respective depth values.
- Data availability table: The node provides a table showing the data availability for each variable, including the number of samples, minimum and maximum values, and the percentage of missing data.
- Depth indexed log visualizations: The node provides a plot of the depth-indexed logs, allowing users to visually inspect the data quality and identify any issues.
- Download Converted File: Users can download the converted file in CSV format.
Legend
- Inputs Nodes:
- Output Nodes: Data Consolidation
Vp/Vs Data QC
Settings
- PROJECT CONFIGURATION: Choose a file to convert from the data management section.
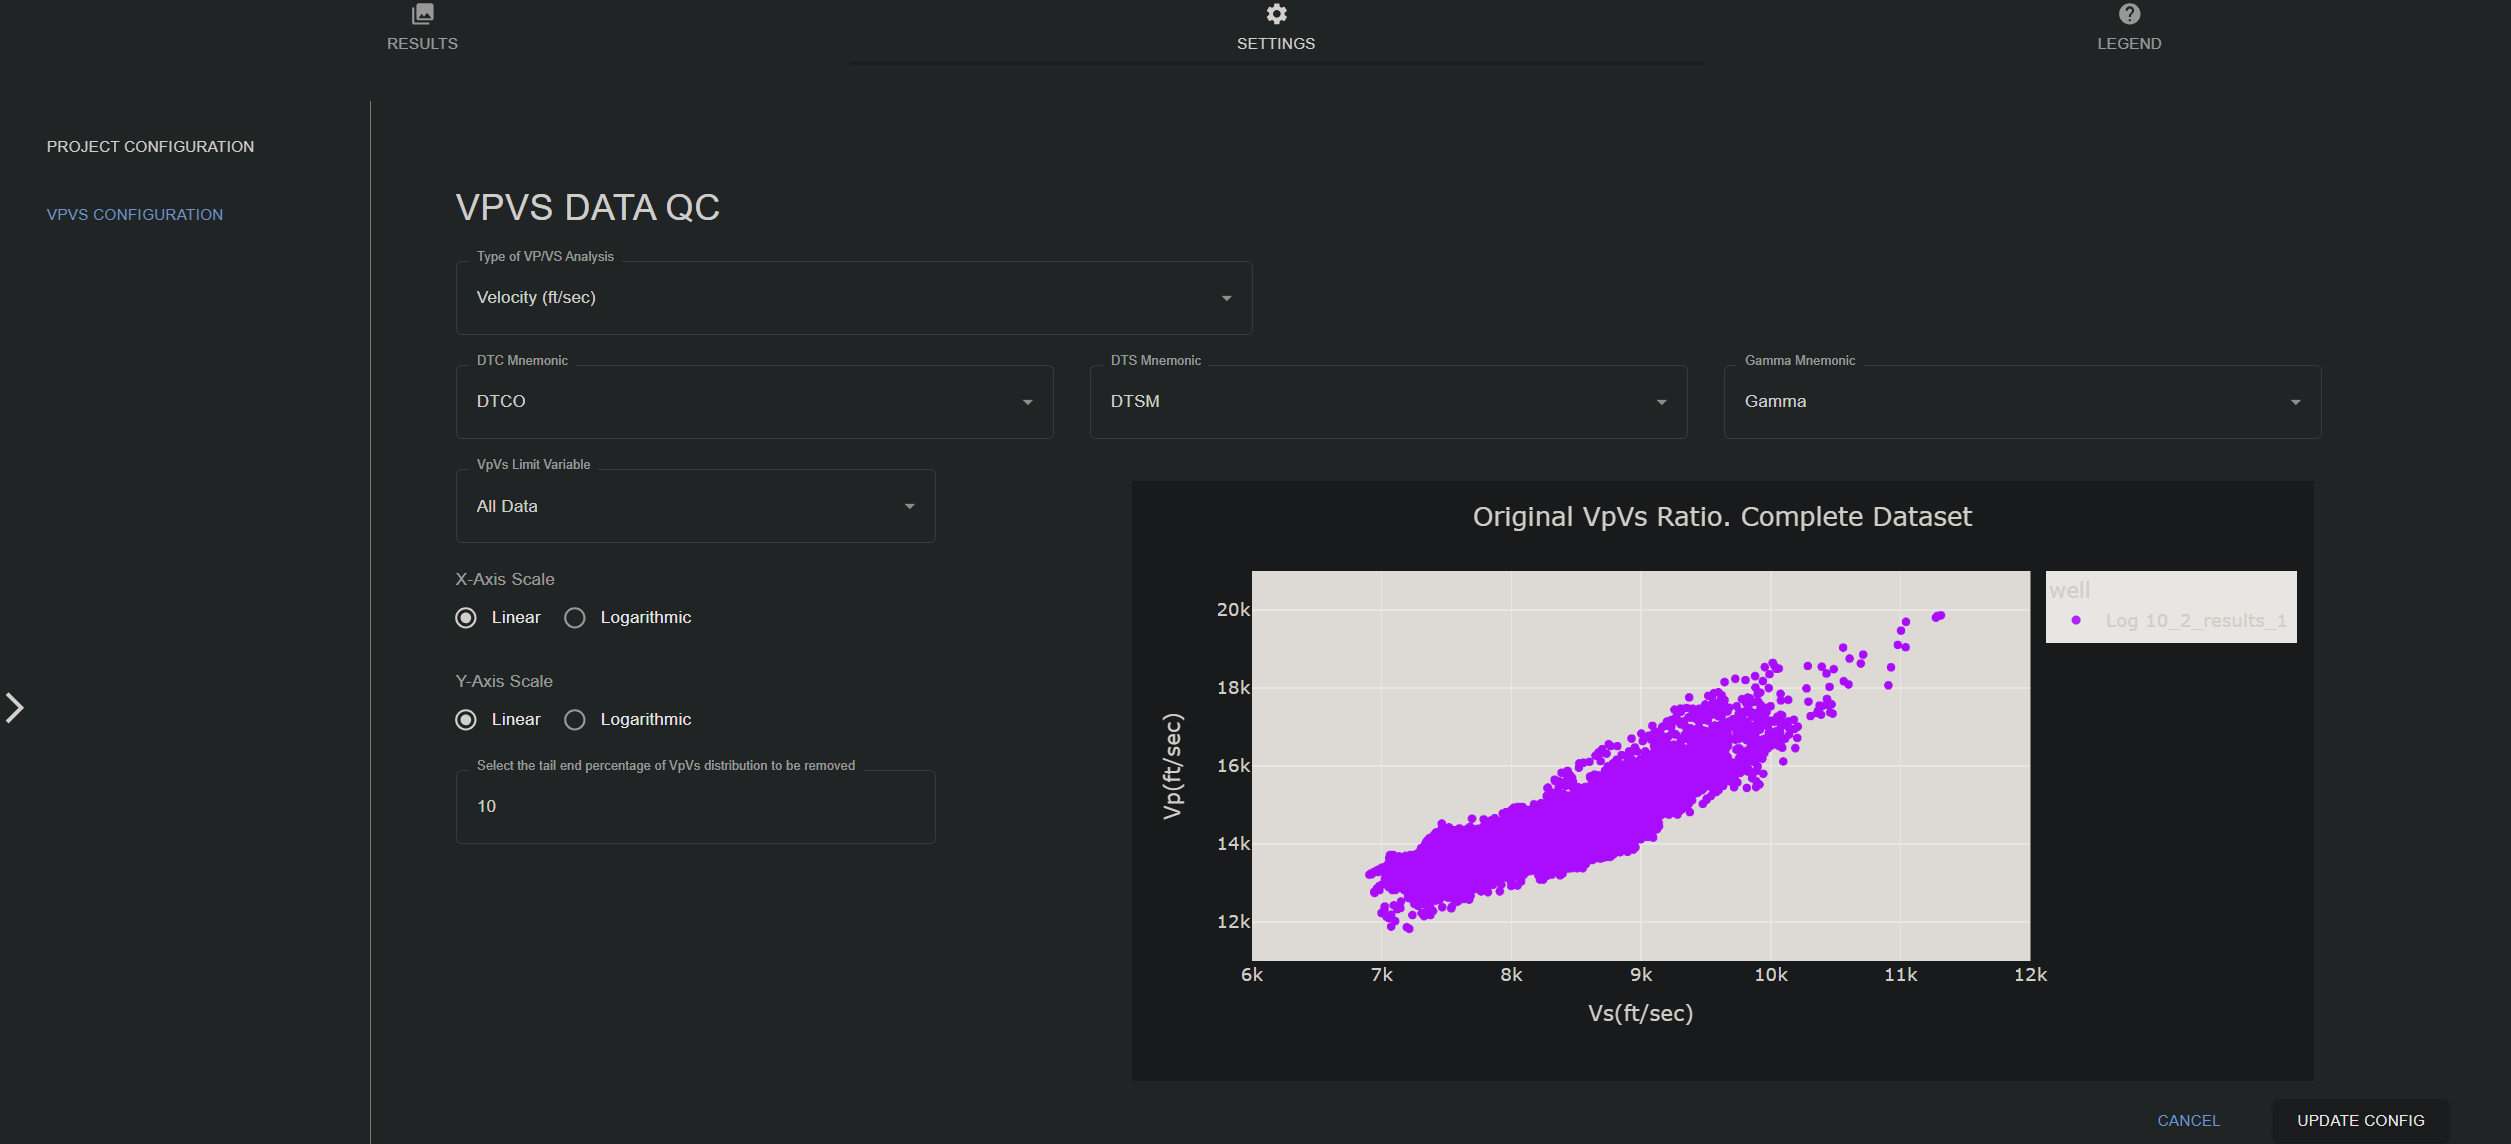
- VPVS CONFIGURATION:
- Type of VP/VS Analysis: Choose between the following options:
- Velocity (ft/sec)
- Velocity (m/sec)
- Slowness (usec/ft)
- DTC Mnemonics: Select the mnemonic for the compressional wave slowness.
- DTS Mnemonic: Select the mnemonic for the shear wave slowness.
- Gamma mnemonic: Select the mnemonic for the gamma ray log.
- VpVs limit variable: All data
- X-Axis Scale: Linear or Logarithmic
- Y-Axis Scale: Linear or Logarithmic
- Select the tail end percentage of VpVs distribution to be removed
- Editable VpVs Table (Dynamic Wells):
- Show Plot
- minVpVs: Set the minimum value of VpVs ratio to be considered valid.
- maxVpVs: Set the maximum value of VpVs ratio to be considered valid.
- Type of VP/VS Analysis: Choose between the following options:
Results
- VPVS Data QC Results: The node generates csv files containing the results of the Vp/Vs data quality control analysis.
- Download VPVS Data QC File: Users can download the Vp/Vs data quality control results in CSV format.
Legend
- Inputs Nodes: Log 10 Conversion, Density Data QC, Slide Analysis, Data Consolidation
- Output Nodes: Slide Analysis, Model Training, Property Prediction, Log 10 Conversion, Density Data QC, Slide Analysis
Density Data QC
Settings
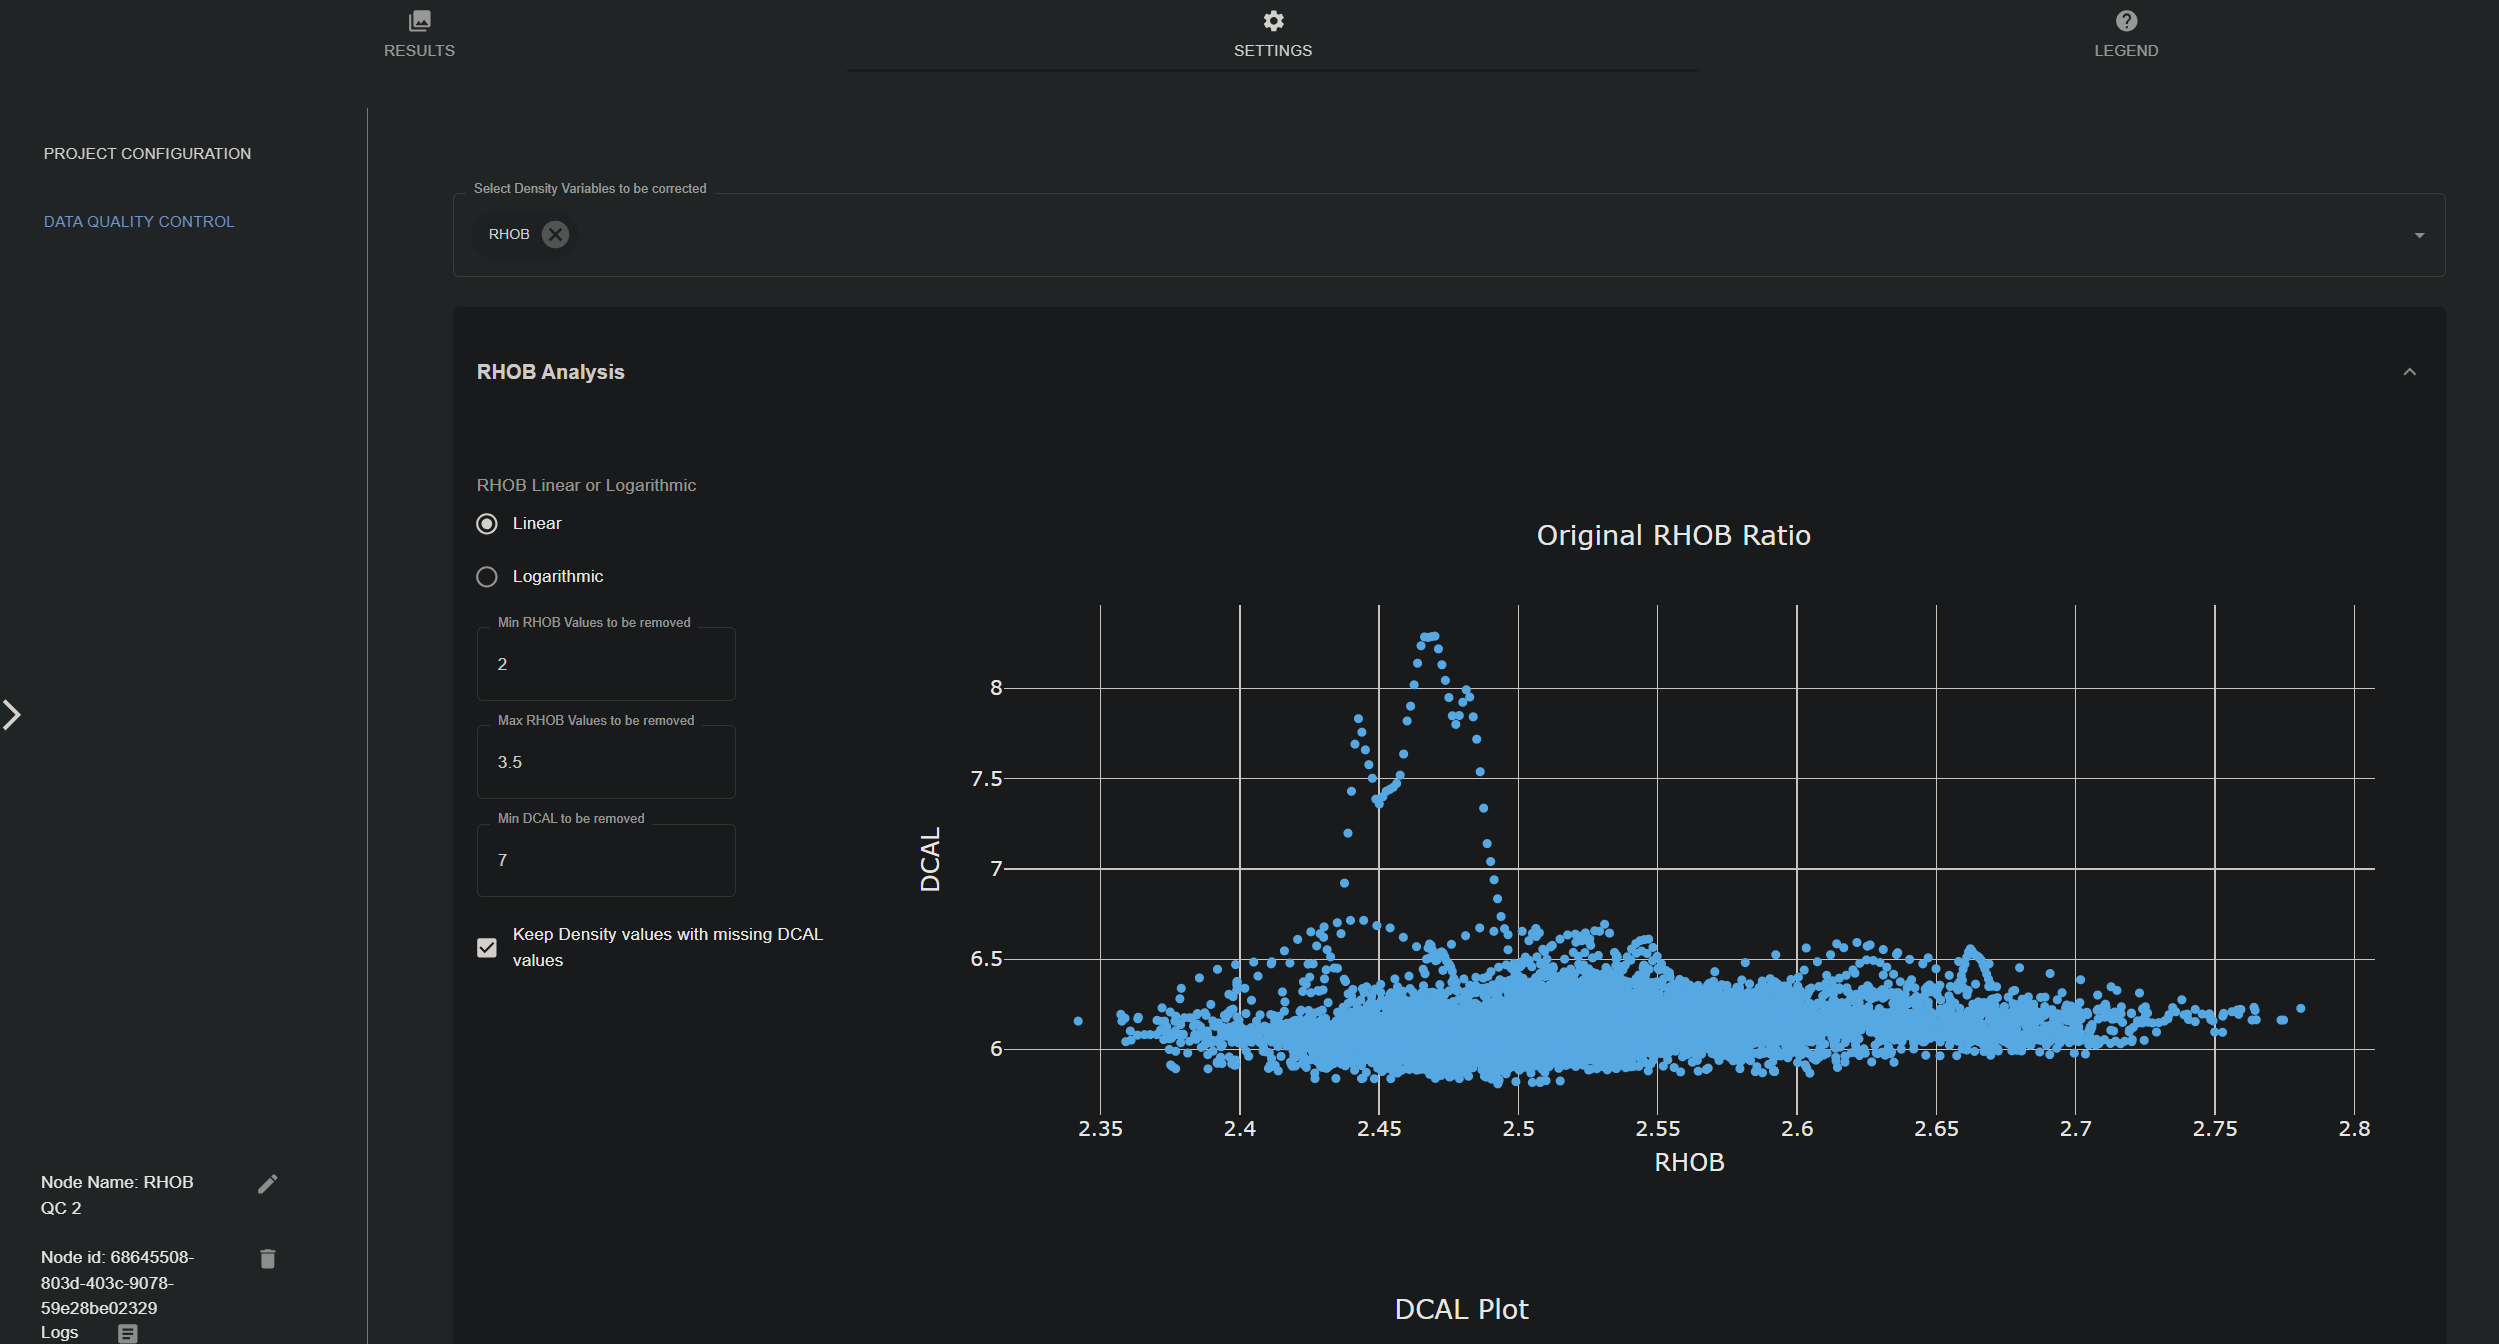
- PROJECT CONFIGURATION: Choose a file to convert from the data management section. The file should contain density data (RHOB(g/cm3)) and caliper data (DCAL(in)).
- Data Quality Control:
- Select density variables to be corrected: Choose the density-related variables from the input file that will be analyzed and corrected based on the configuration.
- RHOB Analysis: Dropdown menu to set thresholds for
- RHOB Linear or Logarithmic: Choose between linear or logarithmic scale for the scatter plot.
- Min RHOB Values to be removed: Set the minimum RHOB value to be considered valid. Default is 2 g/cm3.
- Max RHOB Values to be removed: Set the maximum RHOB value to be considered valid. Default is 3.5 g/cm3.
- Min DCAL to be removed: Set the minimum caliper value to be considered valid. Default is 7 in.
- Keep Density values with missing DCAL values: Enable/disable the option to keep density values even if the corresponding caliper values are missing.
Results
- Density Data QC Results: The node generates csv files containing the results of the density data quality control analysis.
- Download Density Data QC File: Users can download the density data quality control results in CSV format.
Legend
- Inputs Nodes: Log 10 Conversion, Density Data QC, Slide Analysis, Data Consolidation
- Output Nodes: Slide Analysis, Model Training, Property Prediction, Log 10 Conversion, Density Data QC, Slide Analysis
Slide Analysis
Settings
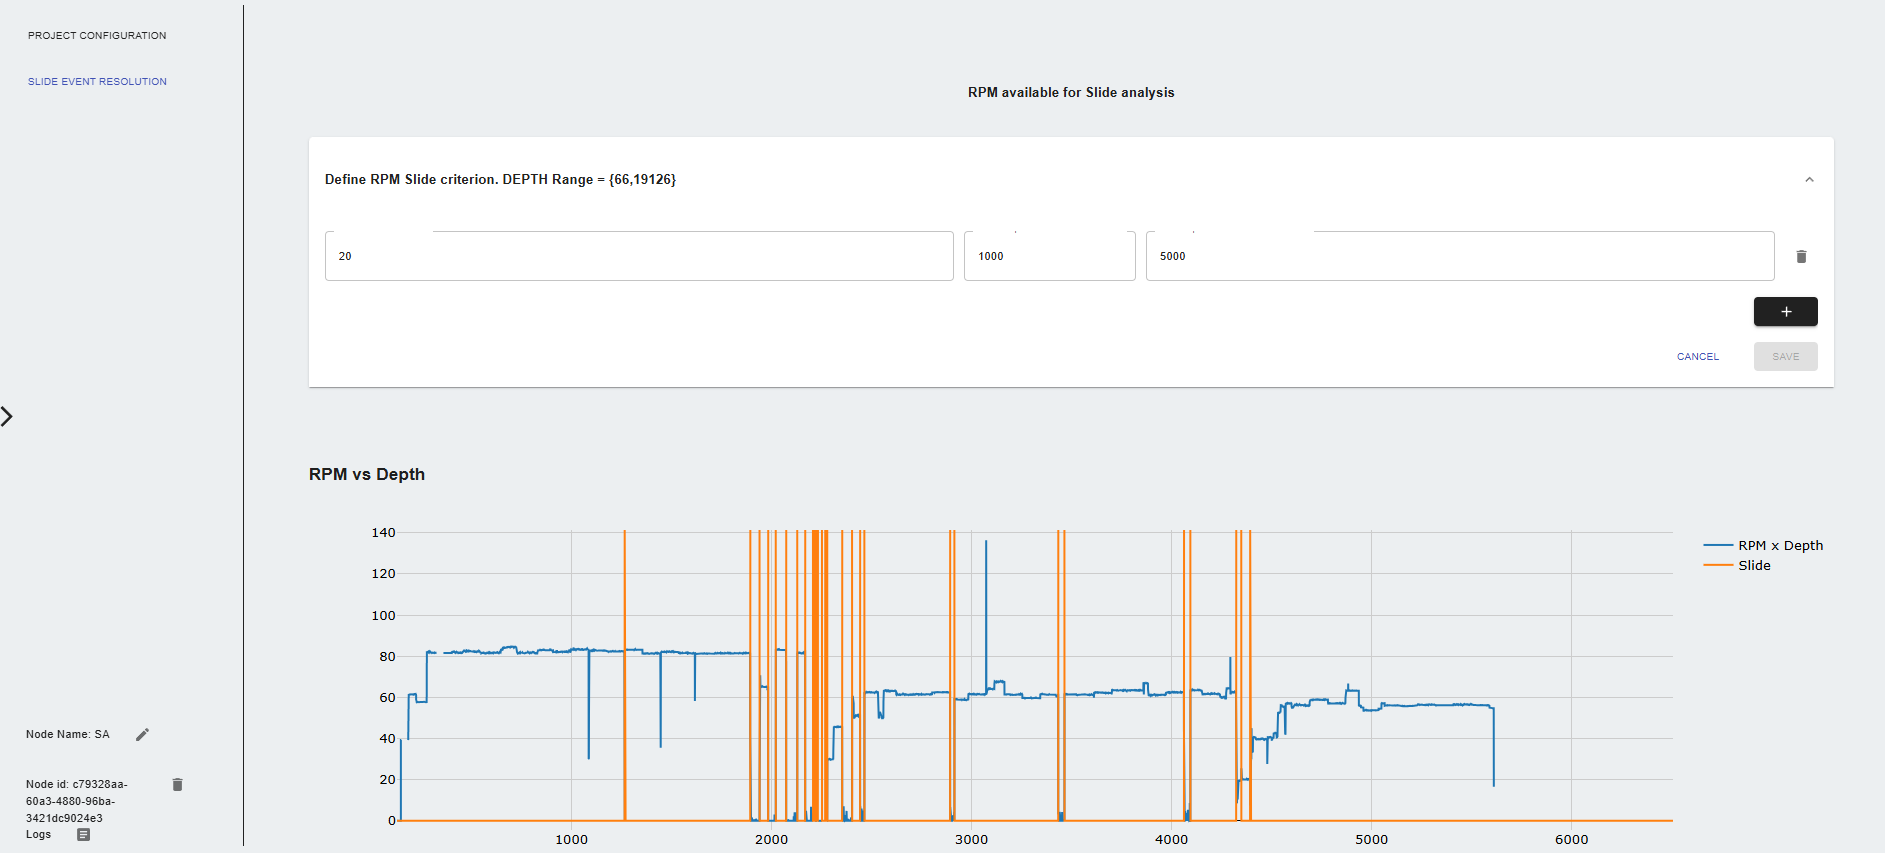
- PROJECT CONFIGURATION: Choose a file to analyze from the data management section or use the output from connected input nodes.
- Define RPM Slide criterion Dropdown menu to set thresholds for slide analysis:
- RPM Threshold value: Set the RPM threshold value for slide analysis.
- Initial depth for RPM threshold: Set initial depth value to flag sliding events.
- Final depth for RPM threshold: Set final depth value to flag sliding events.
- Define TOR Slide criterion Dropdown menu to set thresholds for slide analysis:
- TOR Threshold value: Set the TOR threshold value for slide analysis.
- Initial depth for TOR threshold: Set initial depth value to flag sliding events.
- Final depth for TOR threshold: Set final depth value to flag sliding events.
Results
- Slide Analysis Results: The node generates a file with the slide analysis results, including the flagged sliding events based on the defined criteria.
- Download Slide Analysis File: Users can download the slide analysis results in CSV format.
Legend
- Inputs Nodes: Data Consolidation, Log 10 Conversion, Vp/Vs Data QC, Density Data QC
- Output Nodes: Log 10 Conversion, Time to Depth, Vp/Vs Data QC, Density Data QC, Model Training, Property Prediction
QLog
Model Training
Settings
- PROJECT CONFIGURATION: User can select a consolidated file from the data management section or use the output from connected input nodes. This will be used as the training file.
- Inputs and Targets Configuration:
- Selected Depth Index column: Choose the depth index column from the file.
- Select training targets: Select the variables to be used as training targets.
- Select training inputs: Select the variables to be used as training inputs.
- Constraints configuration:
- Well Range Selection tool: Allows users to limit the range of the well data used for training.
- Apply constraints to all wells: Choose variable that will be used to apply the constraints to all wells.
- Constraint variable: Select the variable to apply the constraints.
- Initial value: Set the minimum value for the constraint.
- Final value: Set the maximum value for the constraint.
- Depth:
- Min depth value: Set the minimum depth value for the constraint.
- Max depth value: Set the maximum depth value for the constraint.
- Coordinates:
- Latitude: Set the latitude value for the constraint.
- Longitude: Set the longitude value for the constraint.
- Despike configuration:
- Remove extreme values: Enable/disable the removal of extreme values from the training data.
- Remove values below: Remove values below a specified threshold.
- Remove values above: Remove values above a specified threshold.
- Despike method: Choose the despike method to be used.
- Despike window size: Set the window size for the despike method.
- Despike Plot: Visualize the despike results to ensure data quality.
- Model Configuration:
- Activation function: Choose the activation function for the model.
- Loss function: Choose the loss function for the model.
- Metric function: Choose the metric used for optimizing the model.
- Batch size: Set the batch size for the model training.
- Number of epochs: Set the number of epochs for the model training.
- Ratio of data reserved for validation: Validation split used to evaluate the model during training.
- Training learning rate: Set the learning rate for the model training.
- Number of epochs with no improvement: Patience for early stopping during training.
- Select neural network type: Feed forward, Recurrent
- Select prebuild architecture: Choose from available prebuilt architectures based on the neural network type selected.
- Include dropout Layer: Enable/disable the dropout layer in the model.
- Dropout rate: Set the dropout rate for the model if dropout layer is enabled.
- Scale Inputs and Outputs: Choose the type of scaler (MinMax, Standard) to be used for scaling the inputs and outputs.
Results
- Training Results: The node generates a file with the training results, including the model architecture, training metrics, and validation metrics. Users can cycle through the individual models.
- Download Model: Users can download the trained model as a zip file.
Legend
- Inputs Nodes: Data Consolidation, Log 10 Conversion, Vp/Vs Data QC, Density Data QC, Slide Analysis
- Output Nodes: Property Prediction
Property Prediction
Settings
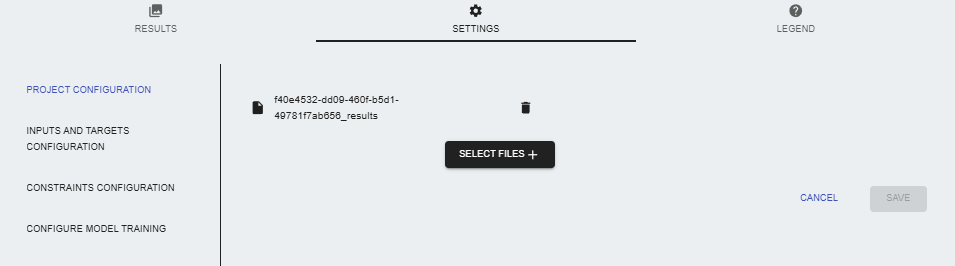
- PROJECT CONFIGURATION: User can select a consolidated file from the data management section or use the output from connected input nodes. This file will be used to generate predictions using the trained model from the Model Training node.
- Pre-simulation quality control:
- Model Evaluation: View model training performance metrics and model parameters. - Model parameters: Displays the model parameters used for training, including the number of layers, neurons, and activation functions. - Wells Availability: Displays the availability of input/target data for each well in the dataset. Also displays the information of wells used for training and prediction.
- Well Range Selection tool: Select the range of wells to be used for prediction. - Apply constraints to all wells: Choose variable that will be used to apply the constraints to all wells. (Min value, Max value) - Constraint variable: Select the variable to apply the constraints. - Initial value: Set the minimum value for the constraint. - Final value: Set the maximum value for the constraint. - Depth: - Min depth value: Set the minimum depth value for the constraint. - Max depth value: Set the maximum depth value for the constraint. - Coordinates: - Latitude: Set the latitude value for the constraint. - Longitude: Set the longitude value for the constraint.
- Despike configuration: Plot the variables to visualize data quality and modify the mnemonic if necessary. - Remove extreme values: Enable/disable the removal of extreme values from the prediction data. - Remove values below: Remove values below a specified threshold. - Remove values above: Remove values above a specified threshold. - Despike method: Choose the despike method to be used. - Despike window size: Set the window size for the despike method. - Despike Plot: Visualize the despike results to ensure data quality.
- Ensemble solution configuration: Choose an ensemble conguration of the model to be used for predictions.
- Create manual ensemble: Manually select the models to be included in the ensemble.
- Use all ensemble: Use all available models for the ensemble.
- Create genetic algorithm filter: Use a genetic algorithm to select the best models for the ensemble.
- Load ensemble solution: Load a pre-existing ensemble solution from the data management section.
- Histograms: Plot the variables to visualize data quality and modify the mnemonic if necessary.
- Simulation configuration:
- Simulation batch size: - None: No batch size is applied. - Data set length: The batch size is set to the length of the dataset. - Fixed size: The batch size is set to a fixed size defined by the user.
Results
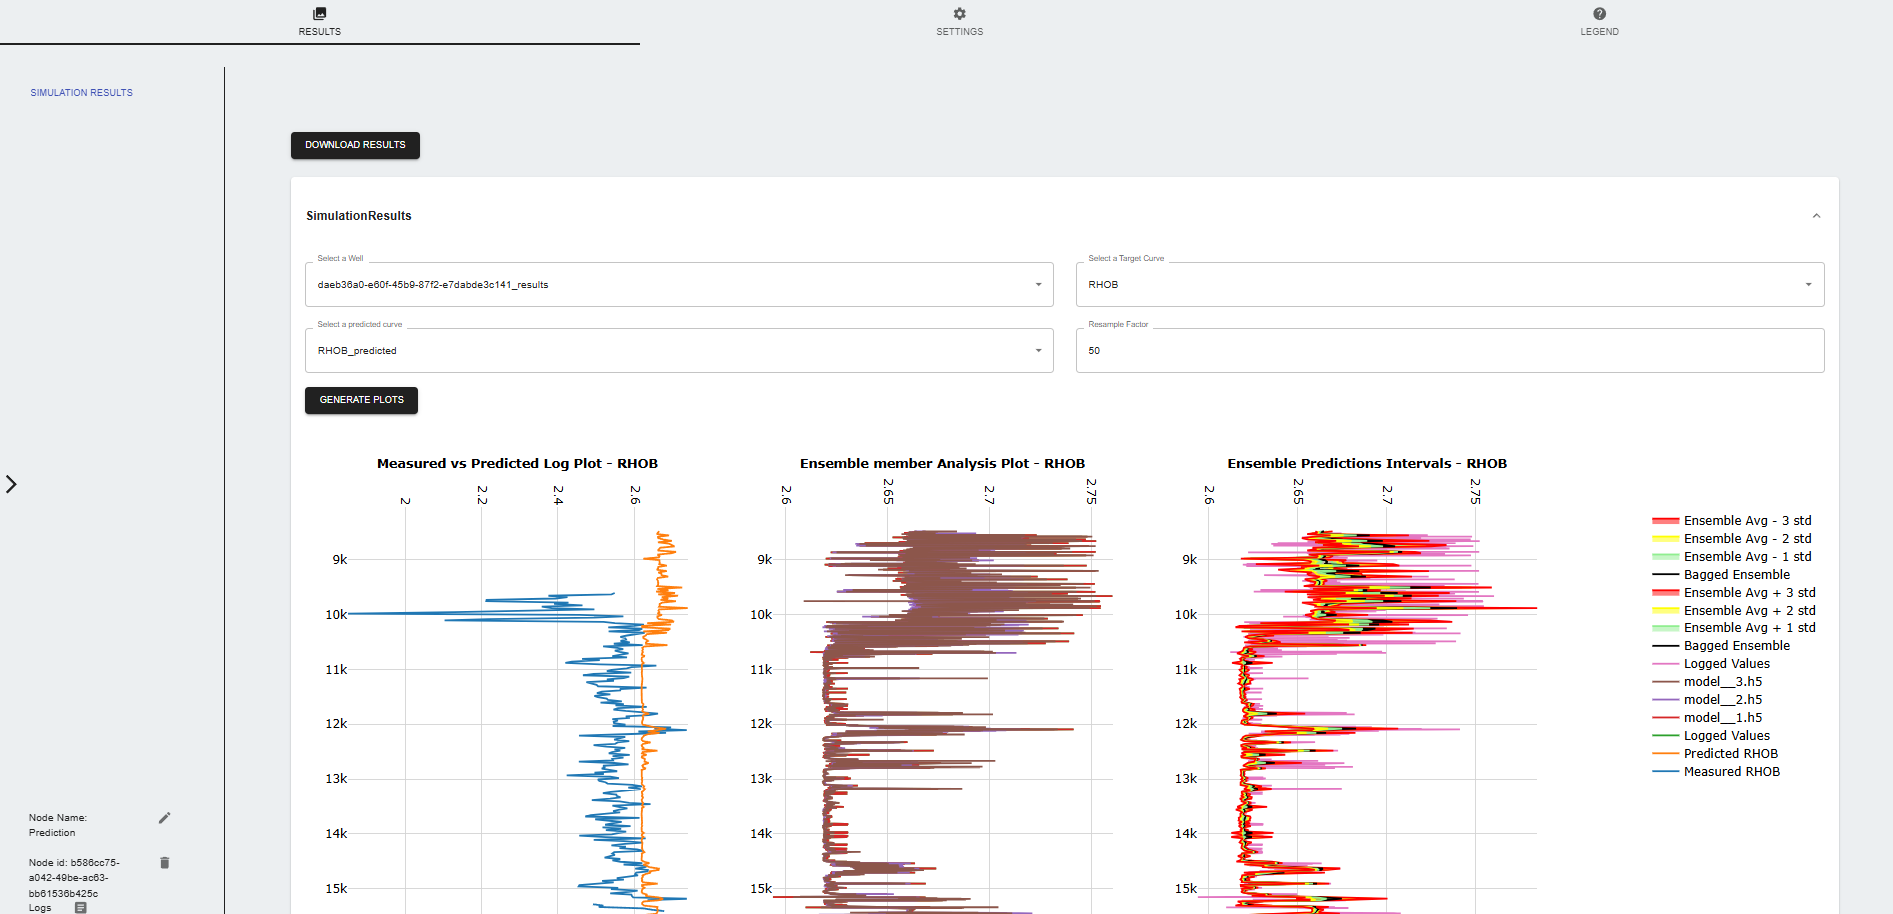
- Simulation Results: The node generates a file with the training results and generates plot to visualize the predictions.
- Download Results: Users can download the predicted results in CSV format.
Legend
- Inputs Nodes: Data Consolidation, Log 10 Conversion, Time to Depth, Model Training, Vp/Vs Data QC, Density Data QC, Slide Analysis
- Output Nodes: