Tutorials
Account management
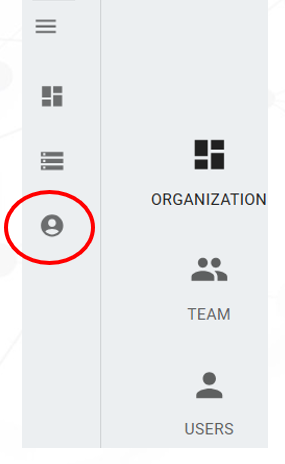
- Select the circled Icon to enter Account Management
- Three options available:
- Organizations:
- Creates independent companies or organizations
- Data, Workflows and Users are independent
- Team:
- Creates different Teams inside an Organization
- Users: Creates different types of users
- Super Admin: With access to all Organizations and Teams
- Admin: User with privileges across multiple Teams
- Regular: User with privileges for only one Team
- Organizations:
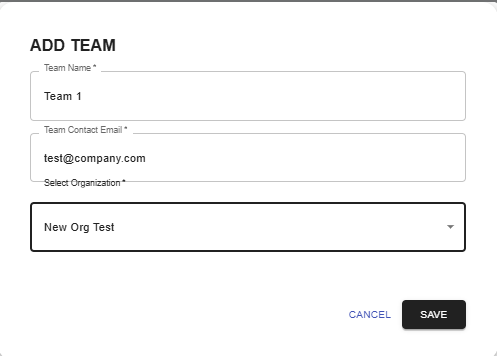
Adding Teams
- Teams are part of an Organization
- User can create a Team for a specific Organization
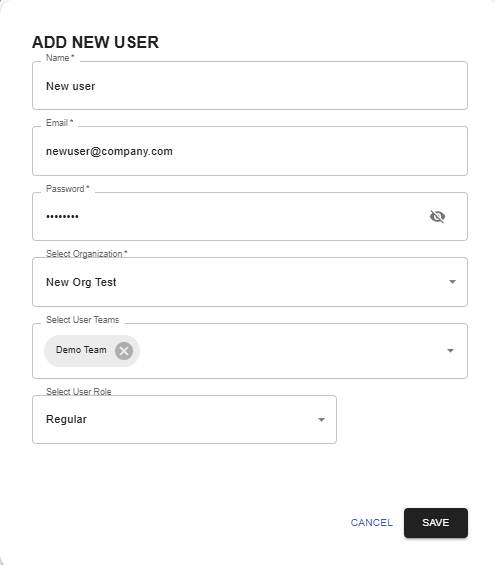
Adding Users
- Add users by selecting:
- Name
- Password
- Team
- User role (Super Admin, Admin, Regular)
Data Management
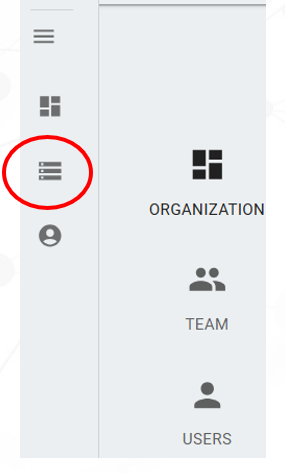
- Select the circled Icon to enter Data Management
- Initially, Data Management will be empty
- The User can create folders and upload multiple files into QLog
- After files are uploaded, the User can download or delete files or folders
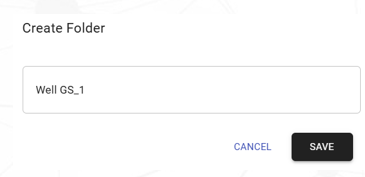
Creating Folders
- The option Create Folder will ask you for a folder name
- Select Save to create the folder
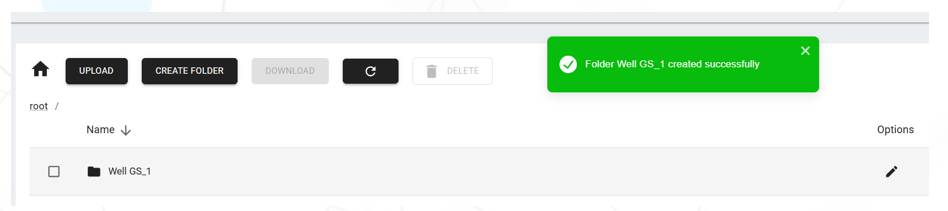
- If successful, a background green message will be presented, and a folder will be available
- Select the folder to add files
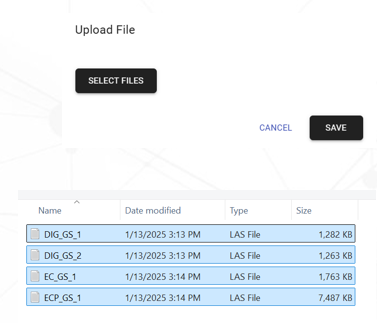
Uploading Files
- The option Upload will allow to add files to the folder
- Click on Select Files and a window will be presented to the user
- Select all the files for the well folder
- Click on Save
- The files will be visible to the User

Workflow
Creating a basic QLog workflow
- Workflow pane will be empty for new Users
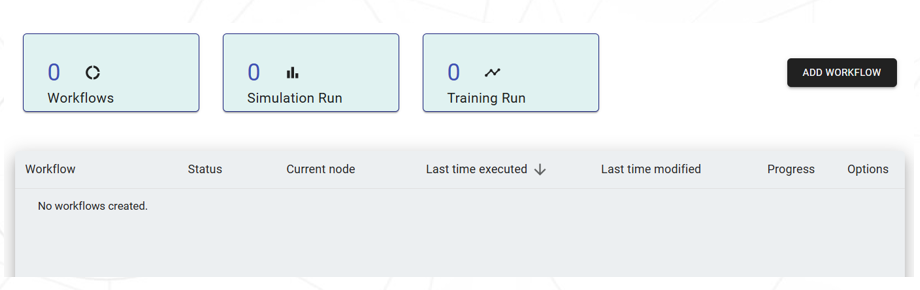
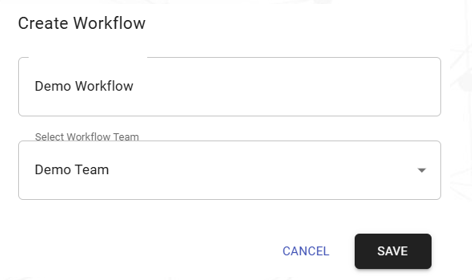
- Select Add Workflow
- Enter name of Workflow
- Select a Team assigned to the User
- Execute Save to create the Workflow
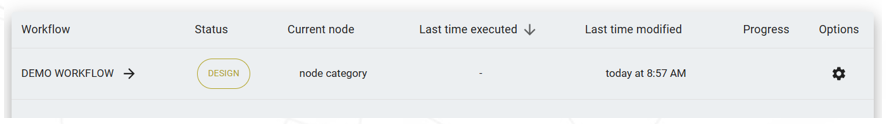
- The original Workflow info is below
- Click over the Workflow name to start the design
Data Consolidation
- The Workflow will be empty
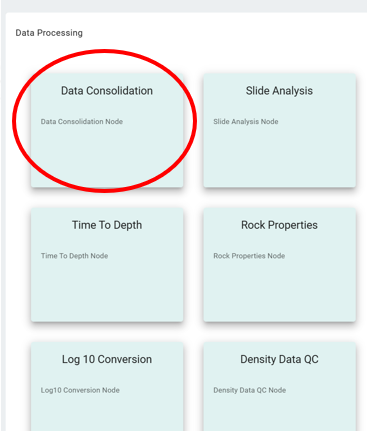
- Select QLog at the upper right corner to see available options
- From Data Processing, select Data Consolidation
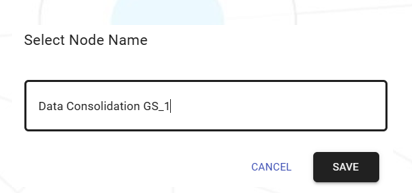
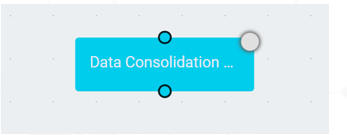
- Select a name for the Node and Save the Node
- Double-click over the Node
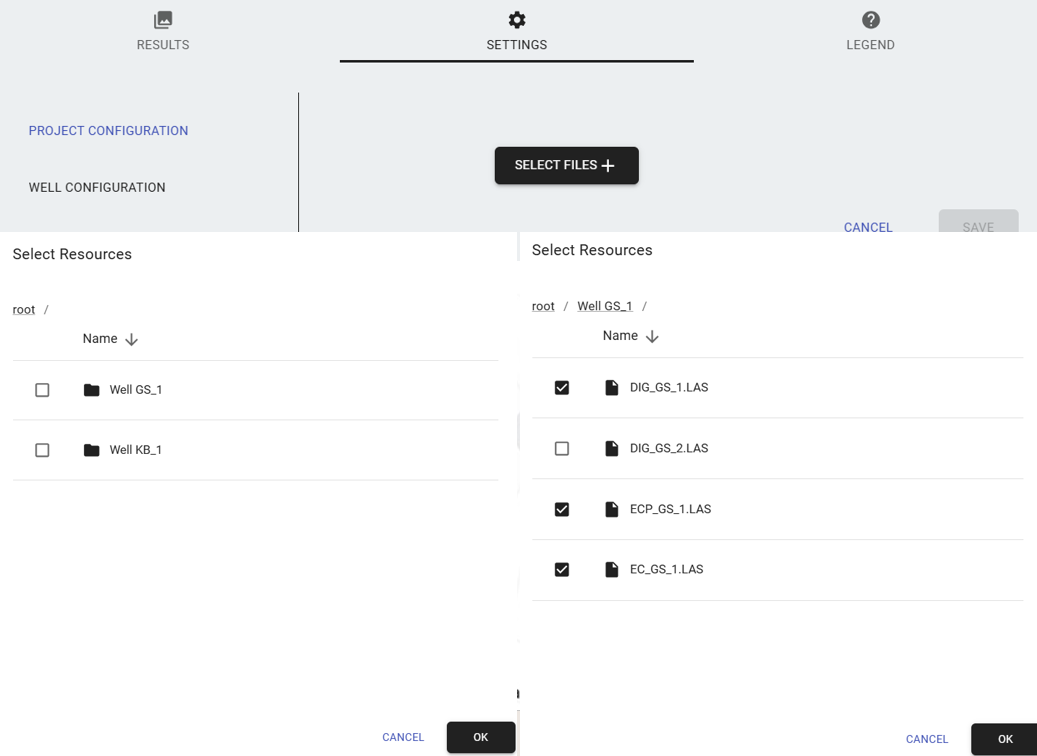
- Click on Select Files to add the well files to be consolidated
- The root folder is presented to the User
- Open folder(s) if data until final location of files
- Select as many files are necessary to configure the well.
- Select Ok to load the files in the Node
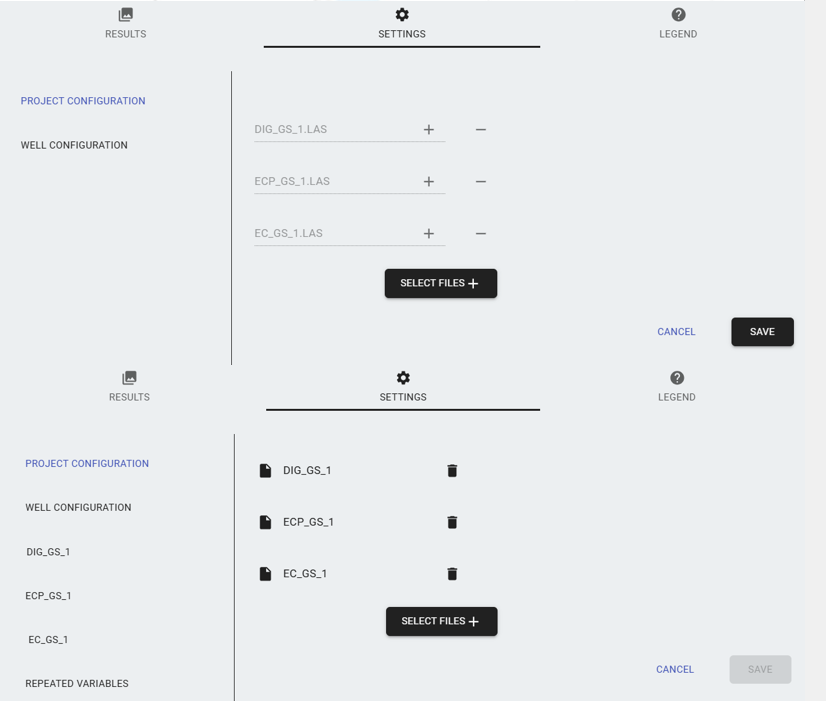
- Initially, the files will be grayed-out
- Click on Save to complete loading of files
- If the files are loaded successfully, the color of the file names changes to black
- New options for configuration of each file and repeated files are now available
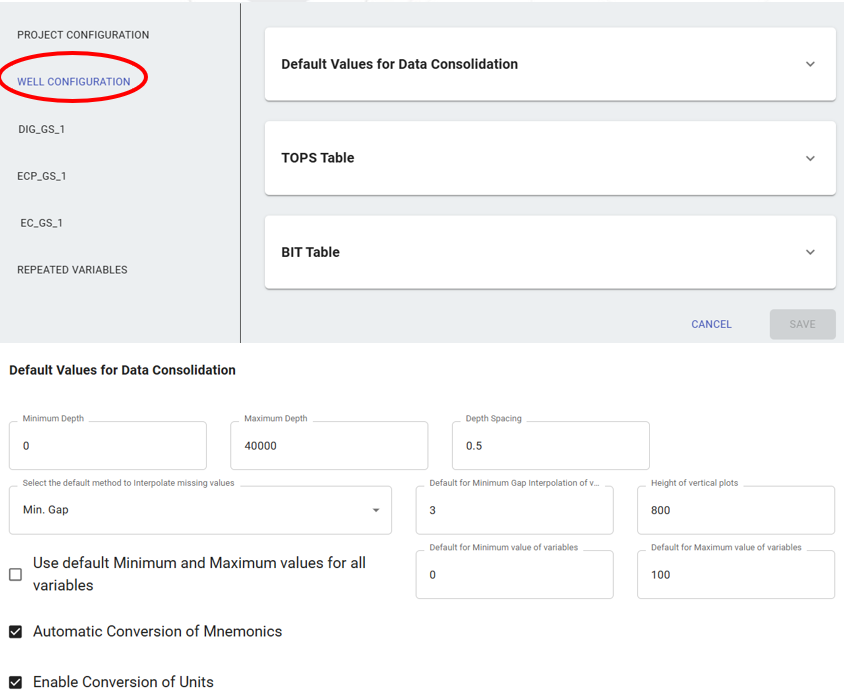
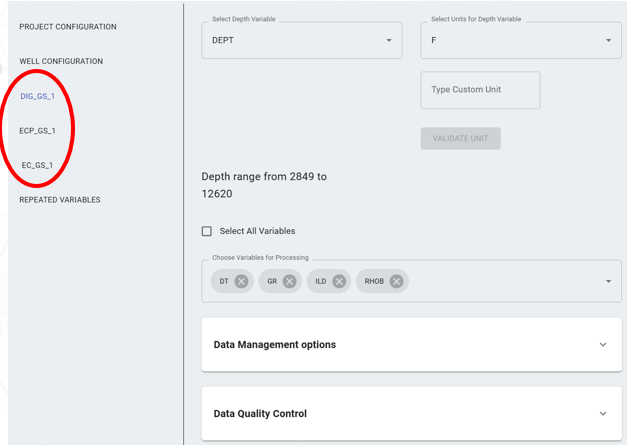
- Under Well Configuration the following options are available:
- Default values for Data Consolidation:
- Well Range
- Depth Spacing
- Default interpolation method
- Size of plots
- Conversion of mnemonics
- Conversion of Engineering Units
- TOPS Table: to define depths for different TOPS values available for vertical wells
- BIT Table: to define Bit sizes along the well
- Default values for Data Consolidation:
- For each well, the User could define:
- Index variable and units
- Select variables to be used from the Log file
- Data Management allows the User to update for each selected variable:
- Mnemonics
- Engineering units
- Minimum and Maximum values
- Interpolation method
- Single visibility of variables
- Data Quality Control allows the user see all variable side-by-side
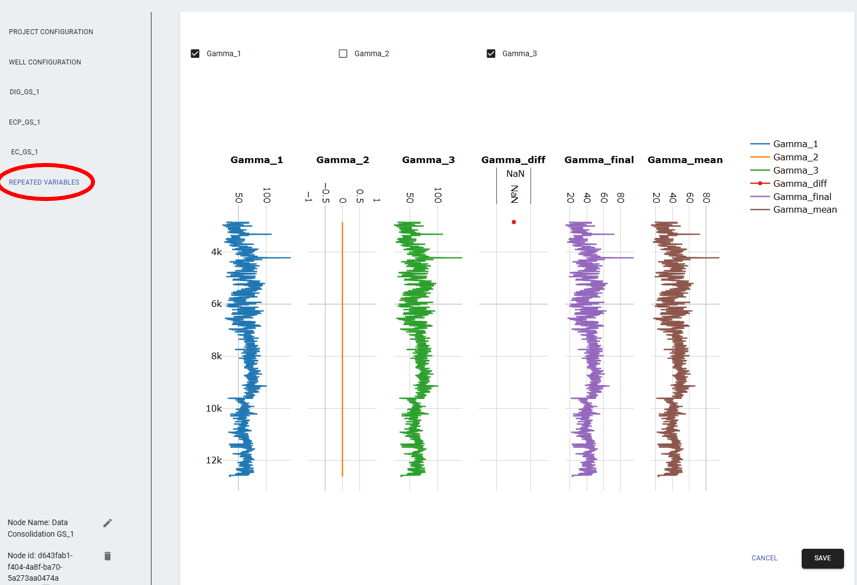
- Repeated Variables will show variable found in more than one file
- Each repeated variable is presented.
- The User can select any combination of variables and see difference and average of multiple selected variables
- Always select Save to process all User changes
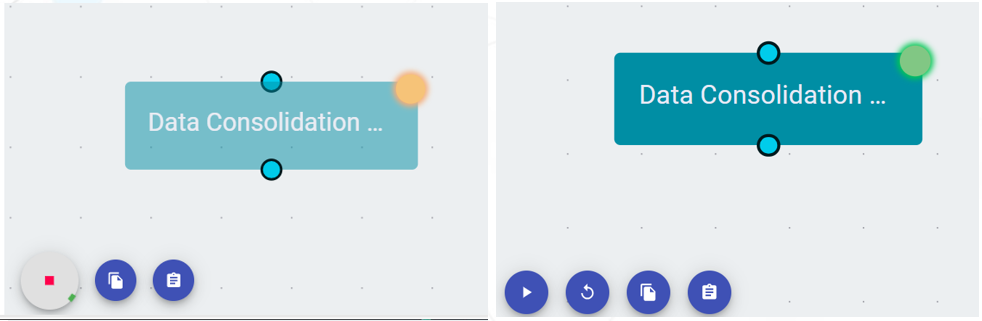
- To process the Node, click the Play Icon at the lower left corner
- The Node will change to Yellow while processing
- If successful, the Node will change to Green
Tips and general guidelines
- The User can add as many files as necessary to the Node - the node will process all files to be combined into a single well/entity.
- For example, if the User has multiple files for a single well - such as multiple logs, tops, bits, etc. - all these files can be added to the same Data Consolidation Node. This process will be repreated for other wells in their respective data consolidation node.
- Every well or entity will usually have a single Data Consolidation Node dedicated to it.
- Each of these data consolidation nodes can now be connected to a singular model training node.
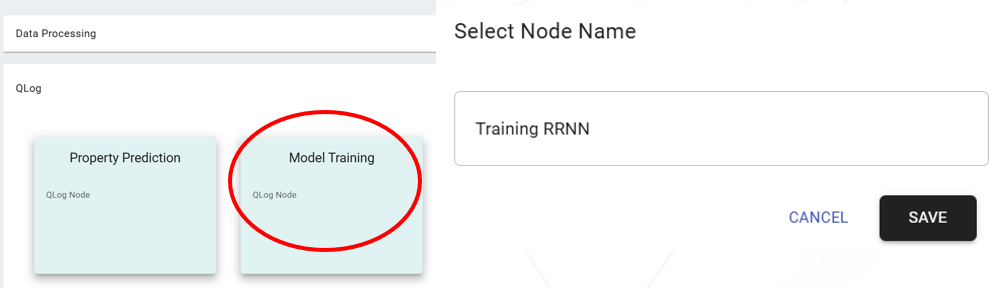
Training node
- The User could select QLog at the Upper right corner and select Training Node from the QLog dropdown.
- Name the Training Node and Save
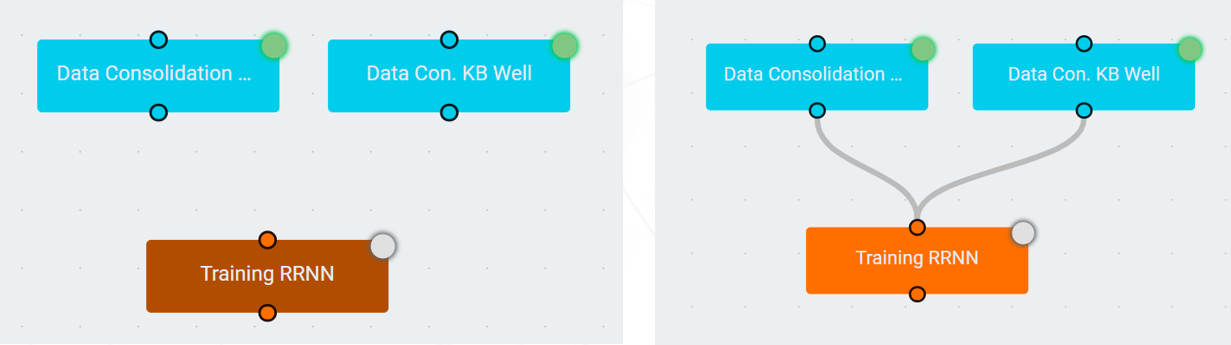
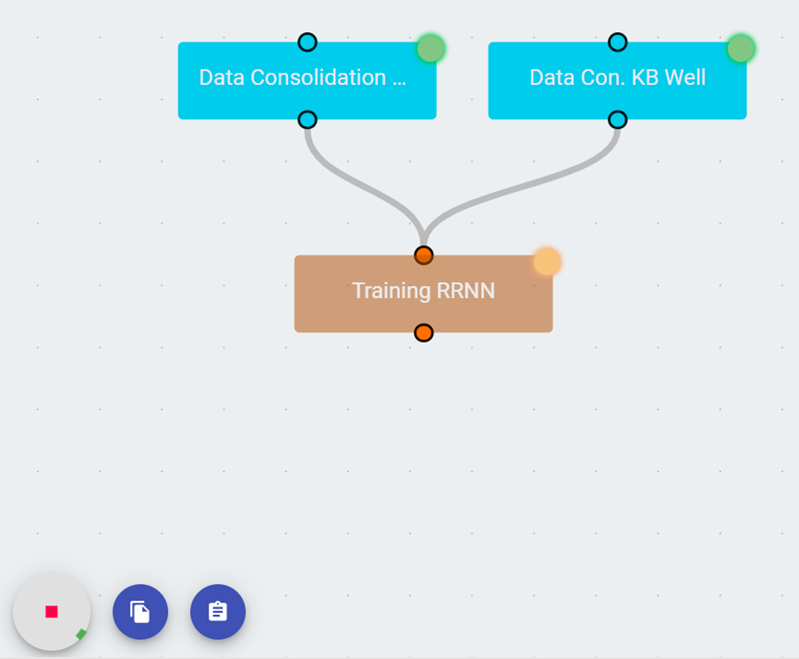
- Initially, Consolidation Nodes and Training Node are not connected
- Connect the nodes using the mouse connecting outputs (bottom of the nodes) to input (top of the nodes)
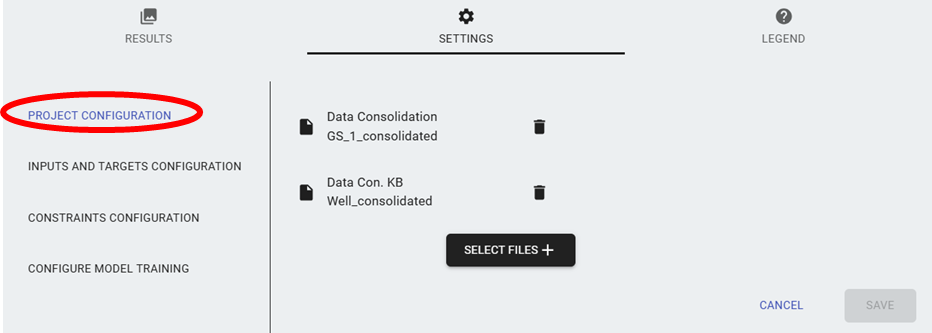
- Open the Training after connection is complete
- The same number of nodes should be presented in Project Configuration
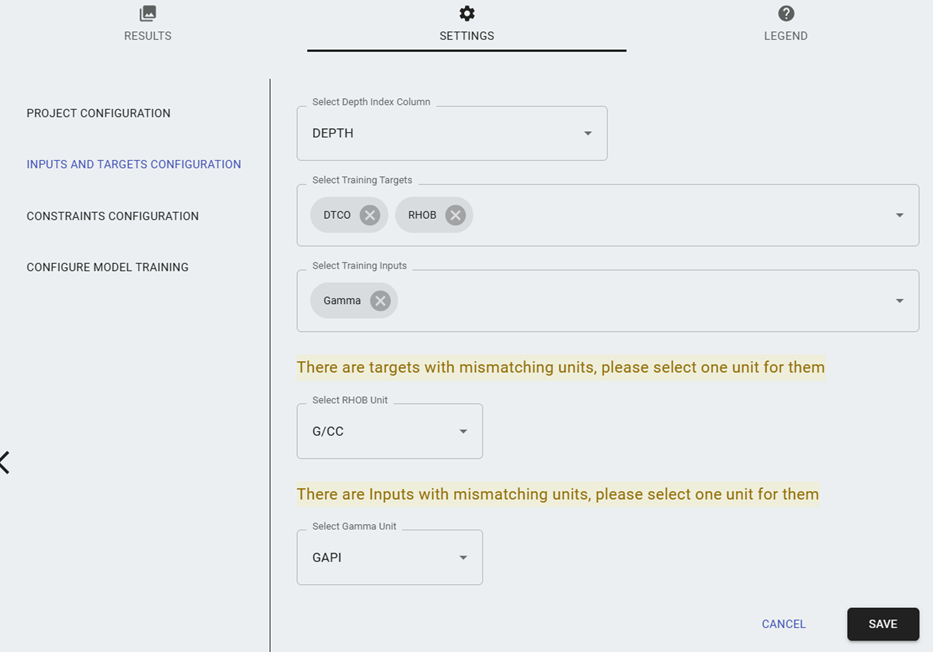
- Next, the User can select Inputs and Outputs
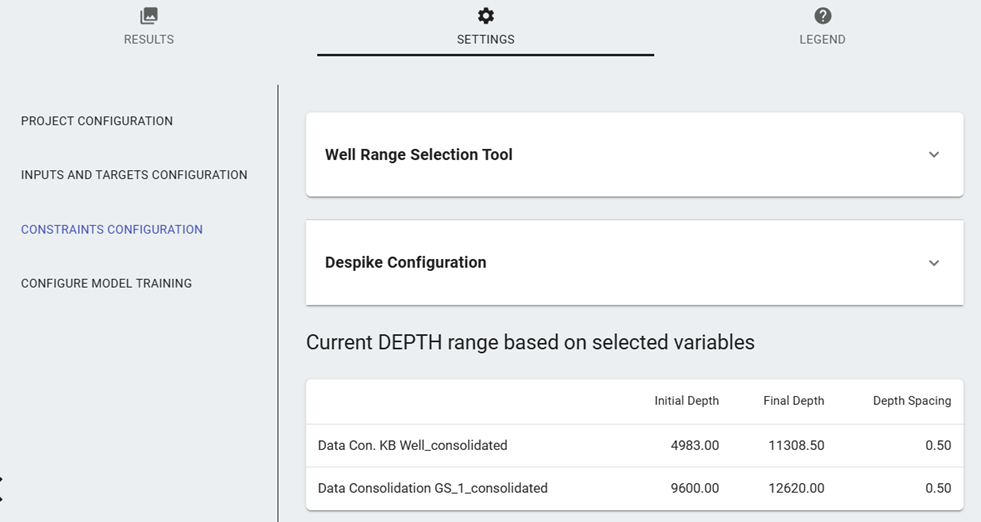
- Constraints Configuration allows the User to:
- Adjust the Range for each well based on well variables or directly by changing the Index limits
- Despike all well signals
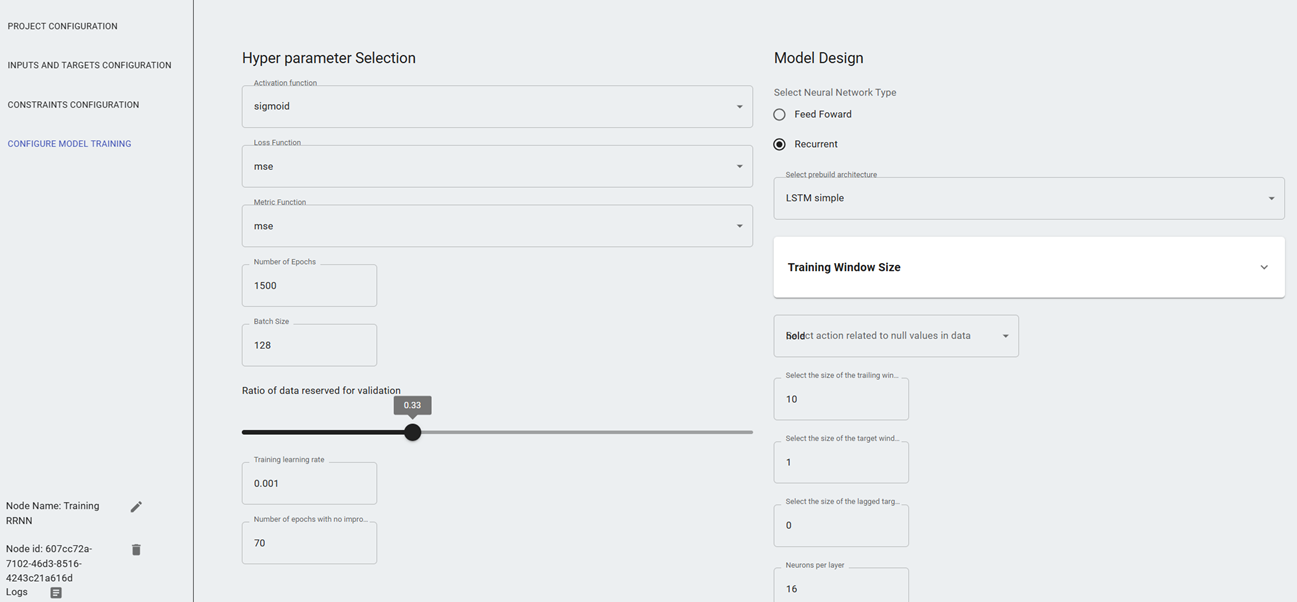
- Configure Model Training allows the user to select Model options
- Save
- Execute the Play Icon to Start Training
- The Node will change to Yellow while in training
- After training, the node should be green
Tips and general guidelines
- The user may connect the input data consolidation nodes to multiple training nodes to train different models at the same time.
- Each training node will be connected to individual property prediction nodes.
Property Prediction Node
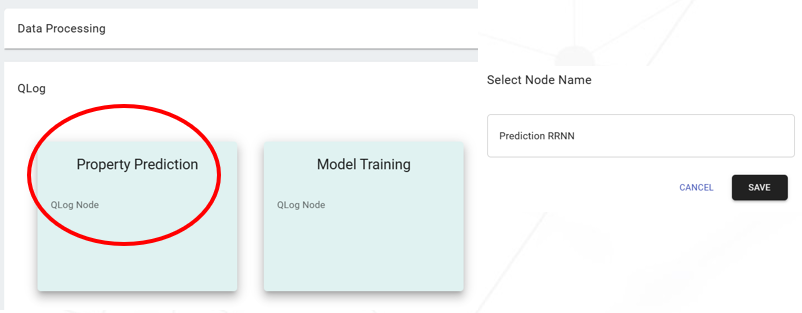
- Select QLog at the Upper right corner
- Select Property Prediction
- Name the Prediction Node and Save
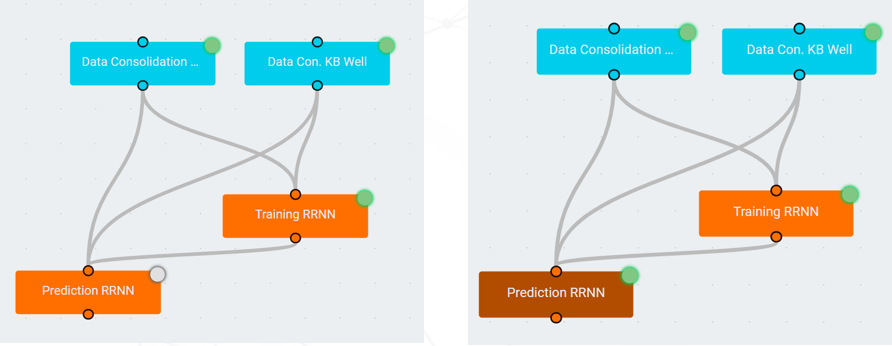
- Connect the outputs of Consolidated Nodes and Training Node to the Prediction Node
- The Prediction Node could be configured using similar options as the Training Node
- Execute the Play Icon to Start Training
- The Node will change to Yellow while processing the data for predictions
- After the data is processed, the node should be green
- By opening the executed Prediction Node, a new results tab is available
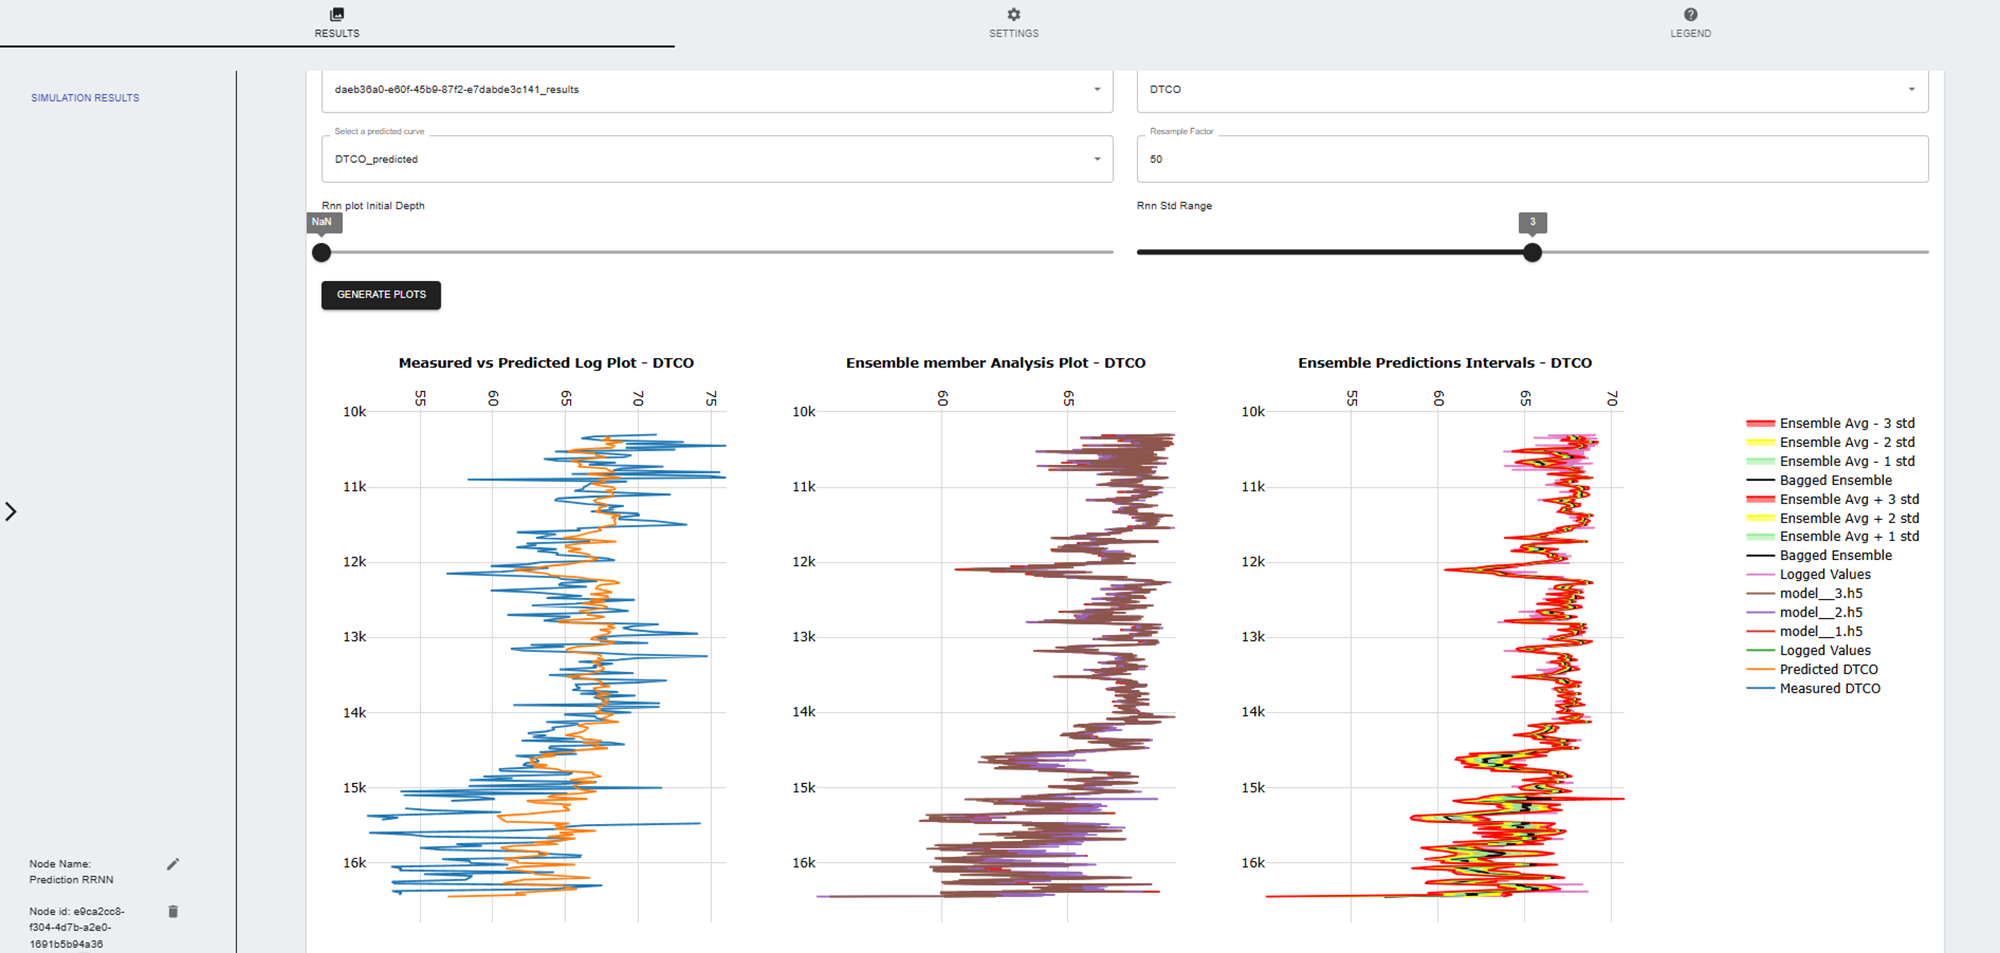
- The User can Download or Generate Plots with the predictions
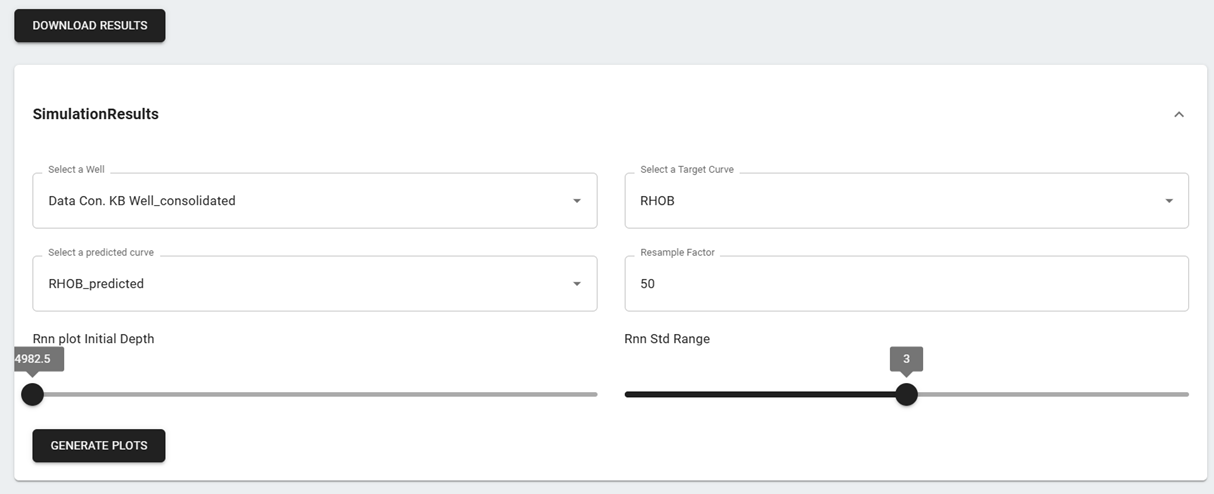
- Example of plots with the predictions
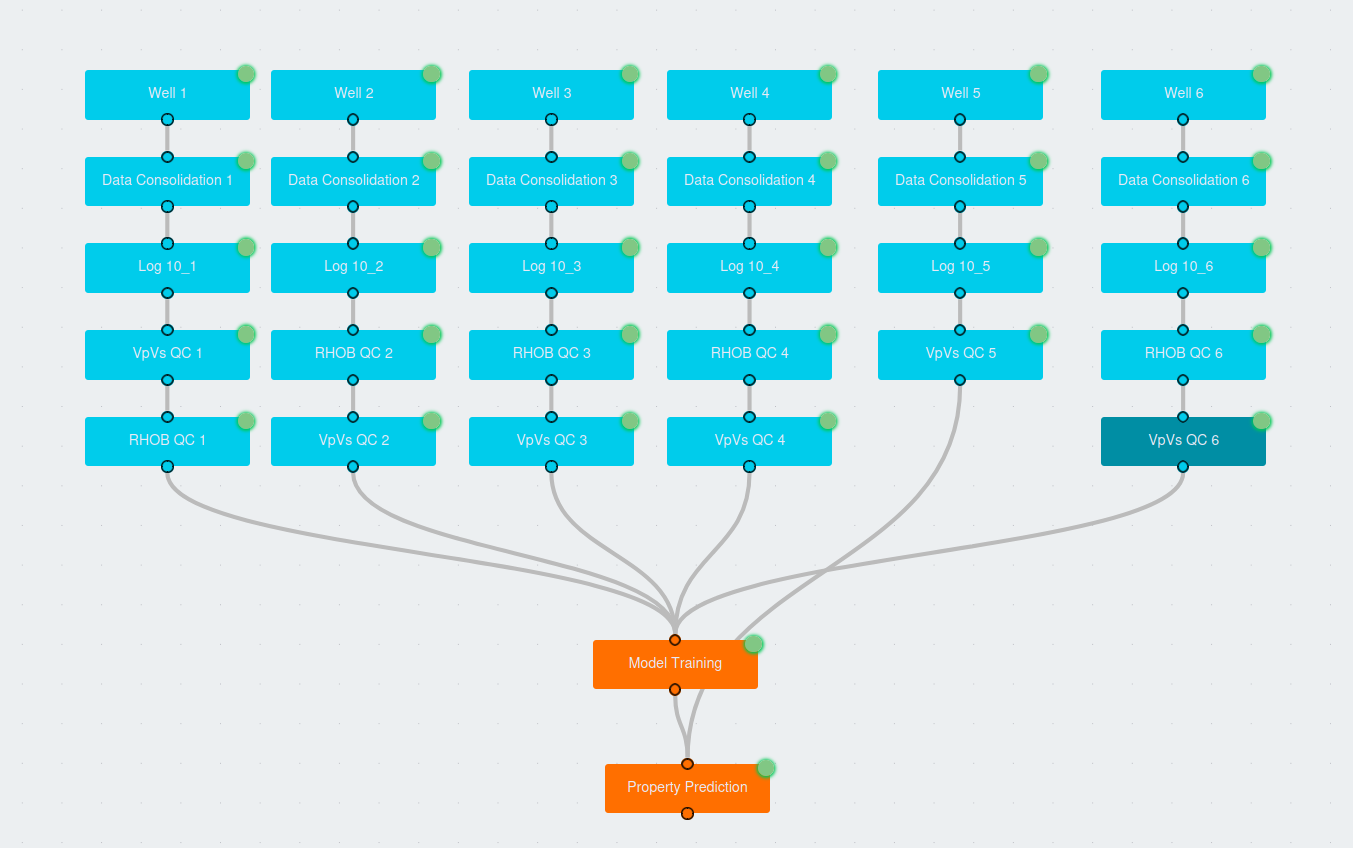
Creating an advanced QLog workflow
Adding more nodes on top of the basic QLog workflow, we can build a more complex workflow including time to depth, Log 10 Conversion, VpVs QC, and Density QC nodes.
Time to depth
- Before data consolidation, time to depth node can be used to preprocess the time-indexed drilling file to remove anomalous values.
- Data consolidation can then be connected to the Log10 conversion node, VpVs QC Node and Density QC Node.
- This node is primarily used to convert time-indexed data to depth-indexed data.
- It is ensured depth values are monotonically increasing and any zones where the depth values are decreasing or abruptly increasing are highlighted in the events section.
- The threshold values is the number of samples containing decreasing depth values from the last valid point.
- Eg, setting this to 50 means atleast 50 data points will need to have non-valid depth values to be flagged in the events.
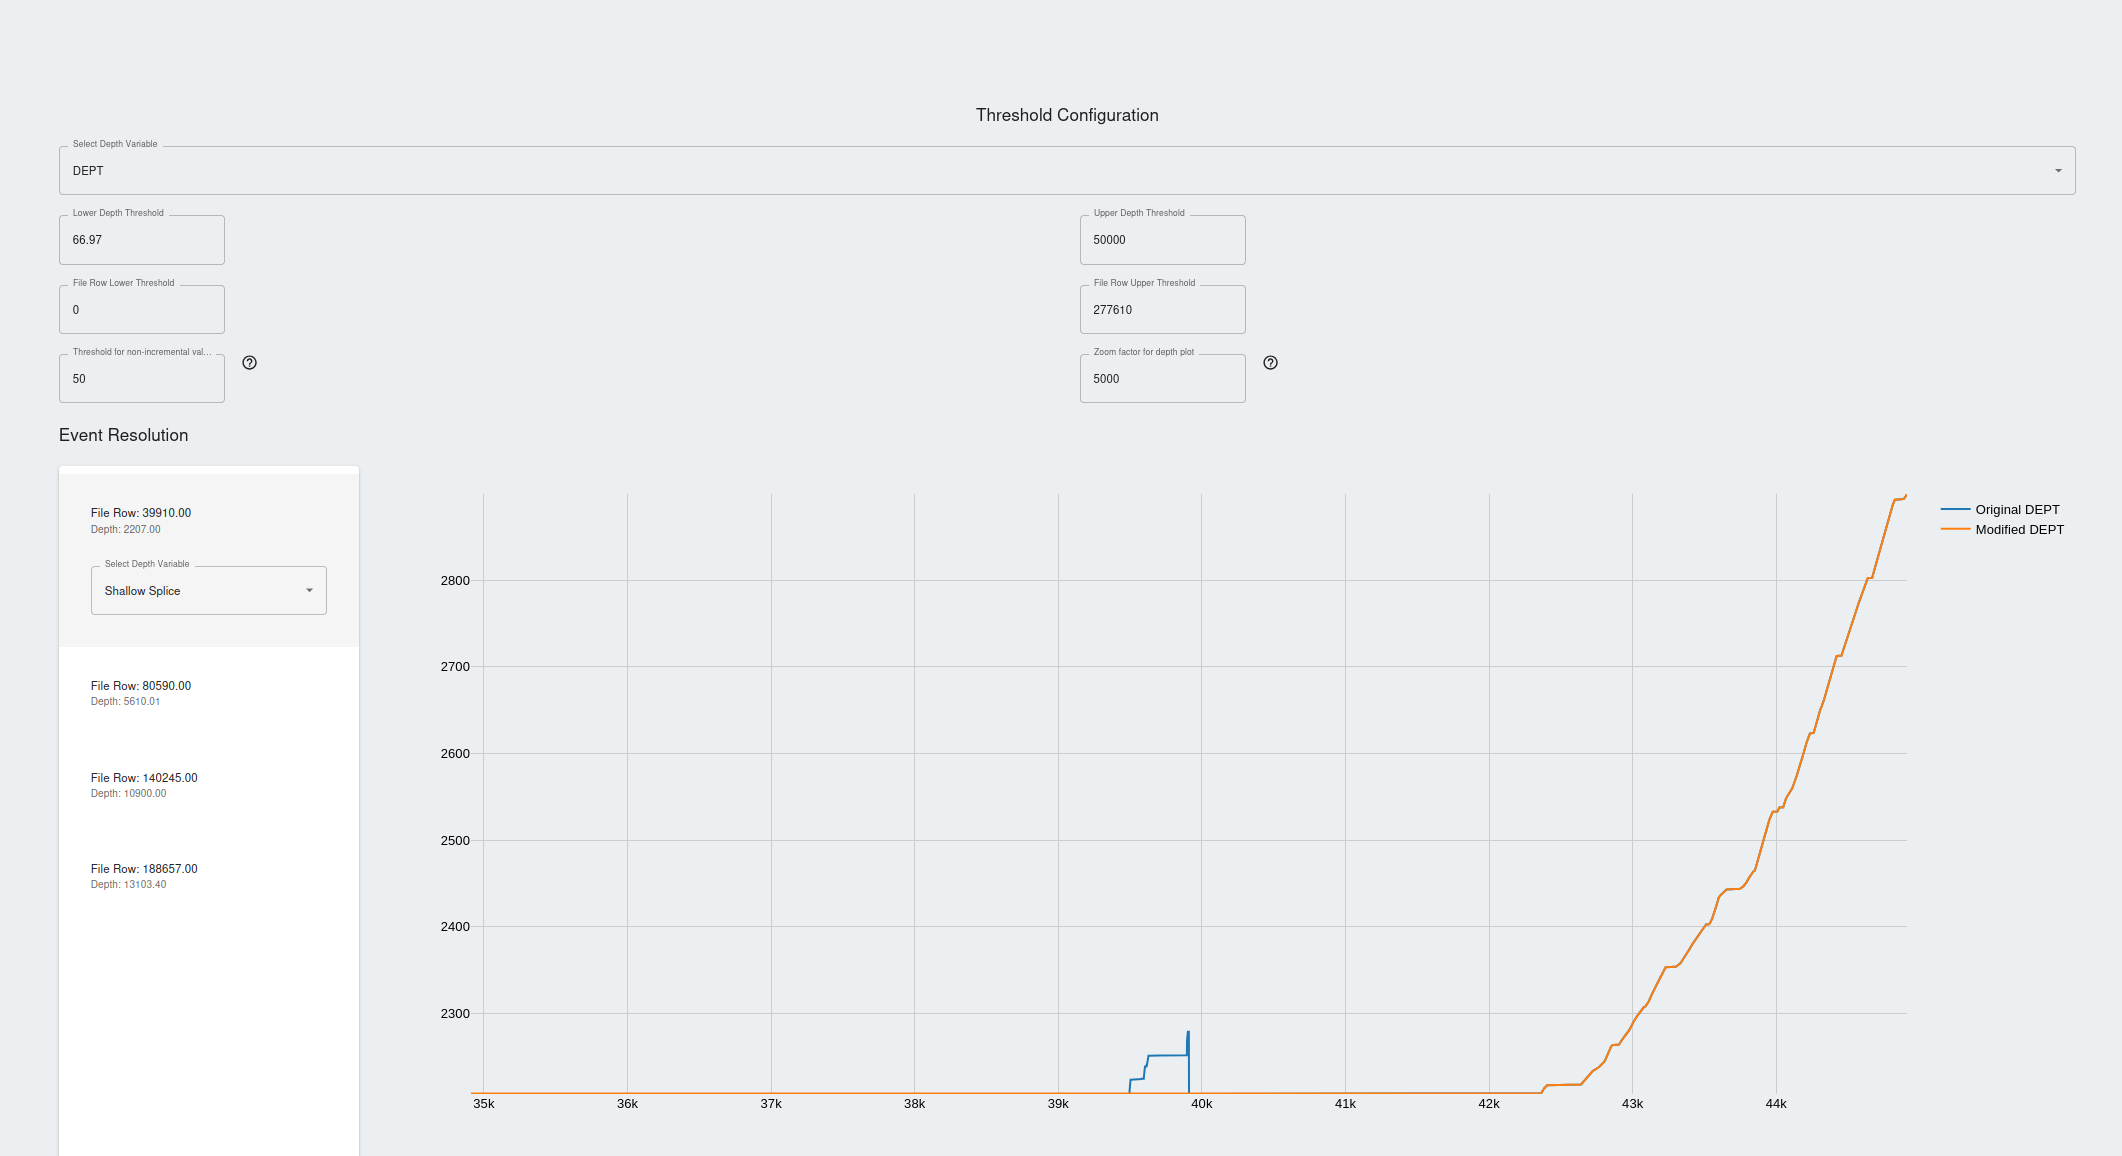
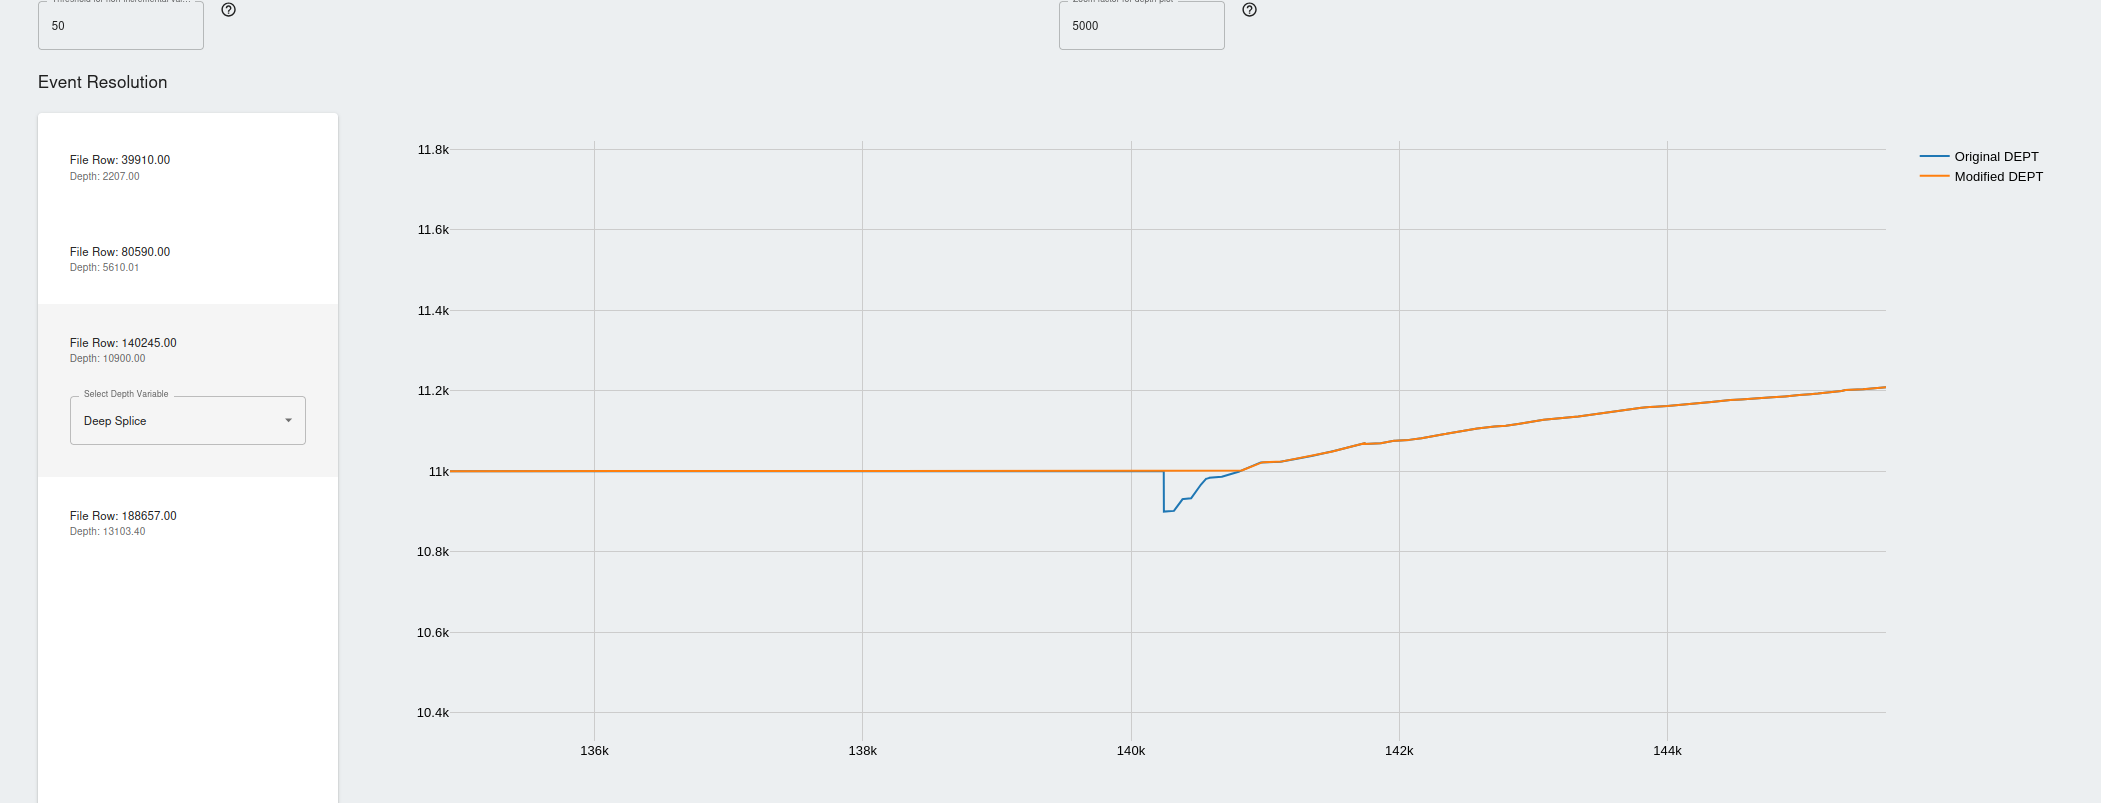
- For each anomalous zone, the events are flagged and the user has the option to apply:
- Deep Splice: Choose deep splice if you would like to remove the depth values lower that the last valid data point and interpolate the data till the next data point with valid depth values.
- Shallow Splice: * Deep Splice: Choose deep splice if you would like to remove the depth values higher that the last valid data point and interpolate the data till the next data point with valid depth values.
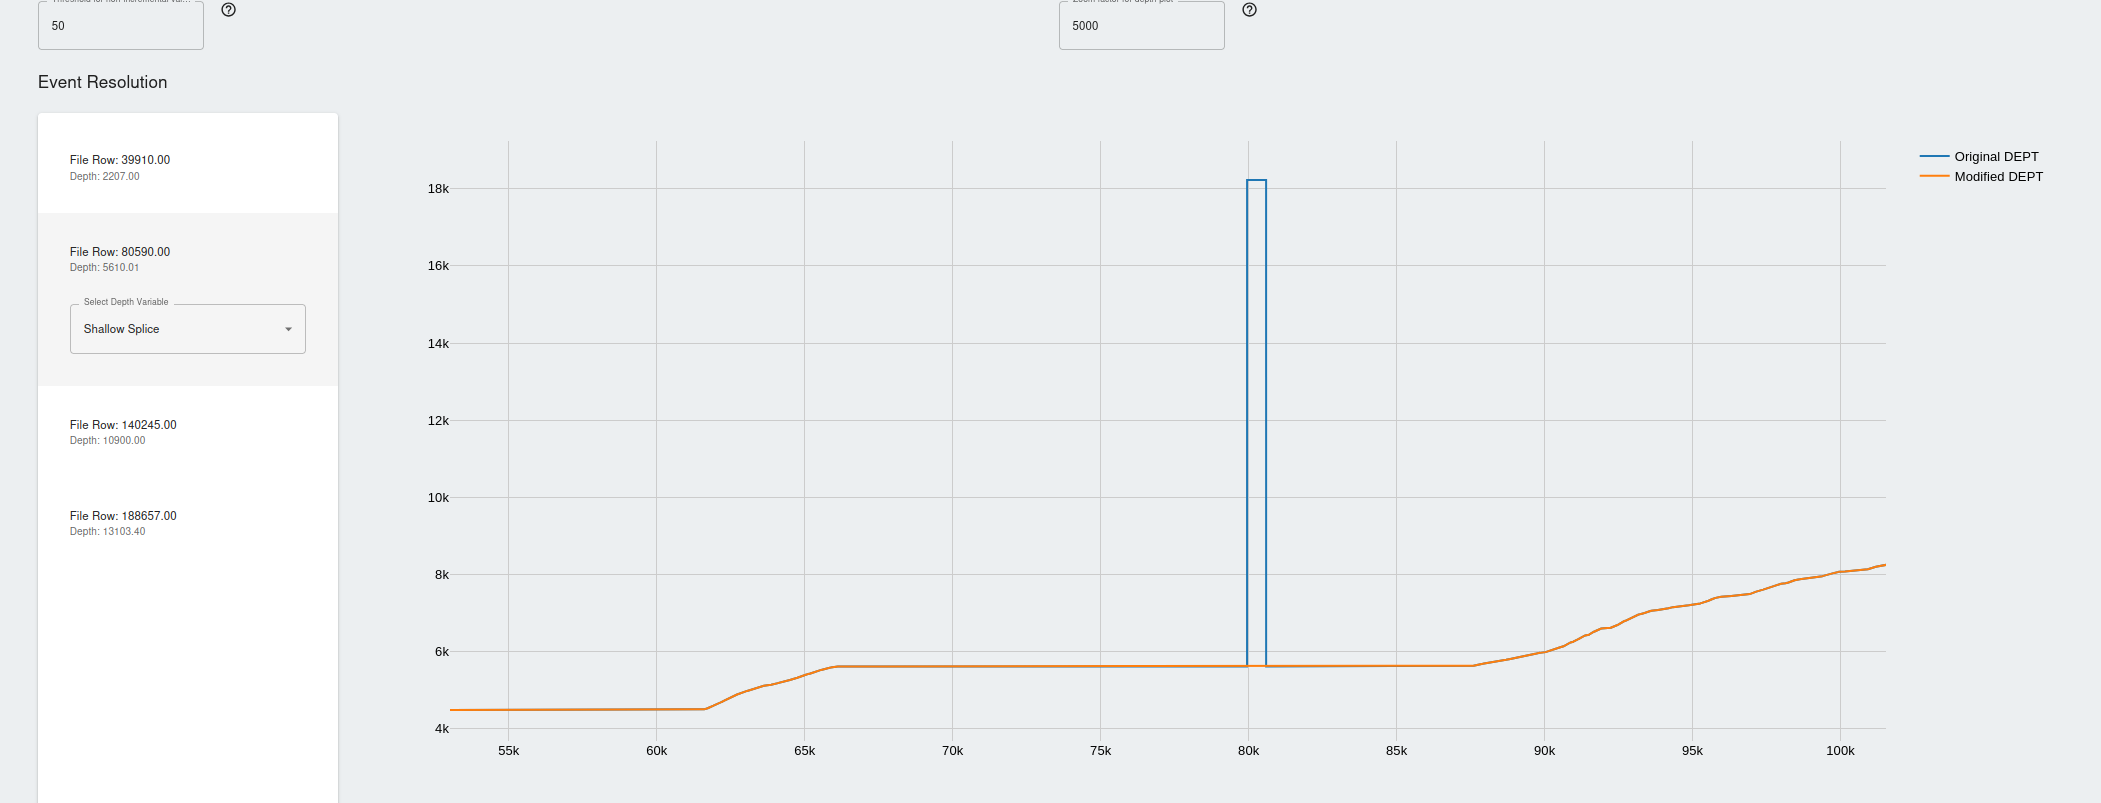
- No Action: Do not perform any splicing
- Deep Splice: Choose deep splice if you would like to remove the depth values lower that the last valid data point and interpolate the data till the next data point with valid depth values.
- Apply the desired actions to all the events and save the node. The results can be viewed and this node can be used as input to the data consolidation node.
Data Consolidation
- Refer to the QLog basic workflow to configure the data consolidation node.
- The Time to depth node can be attached as an input to the data consolidation node to use the results as an additional file for consolidation.
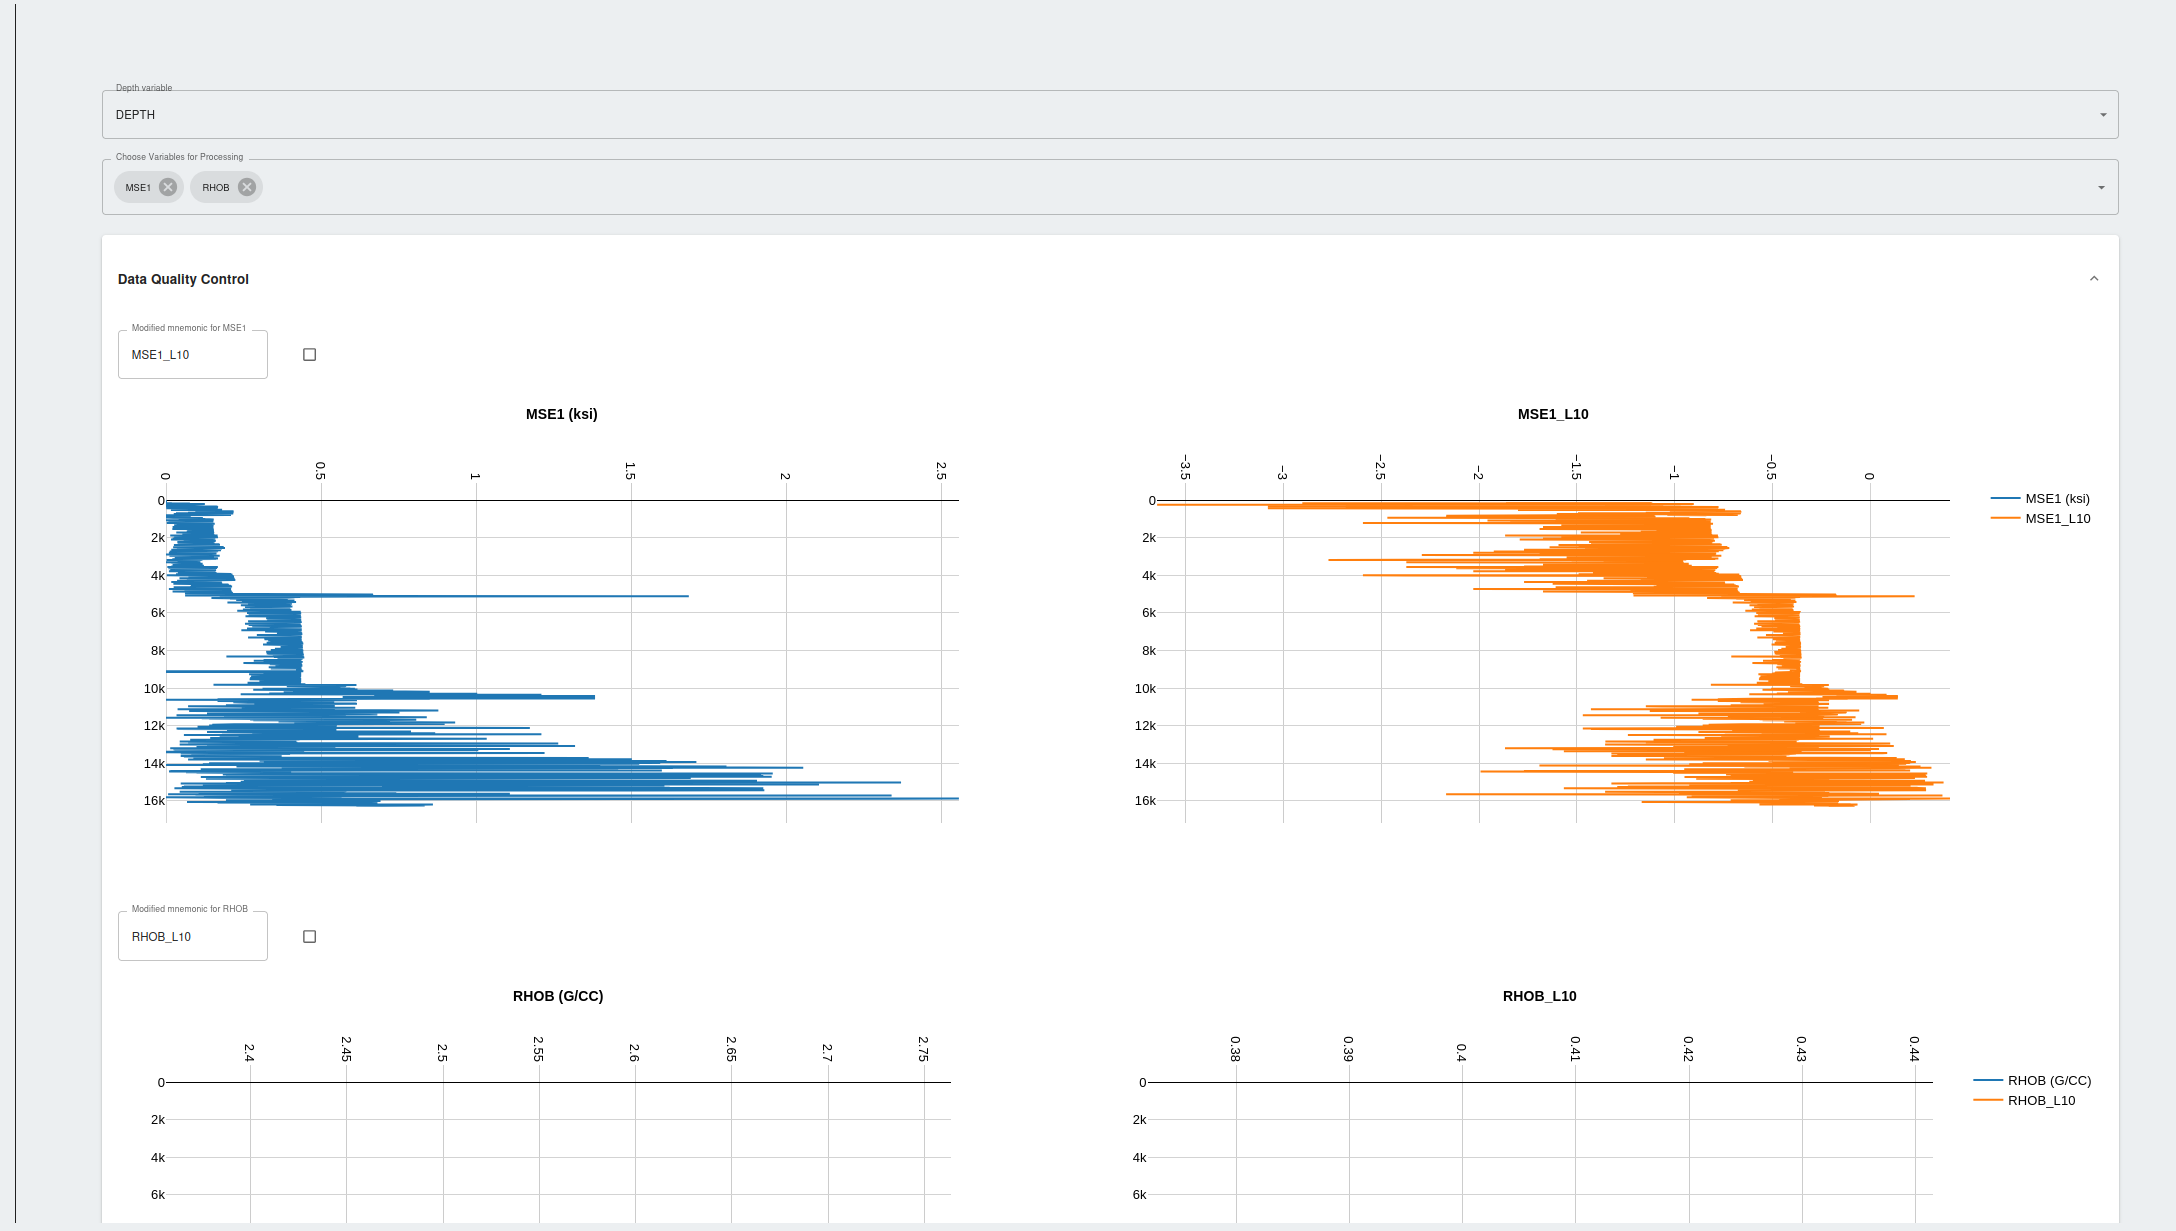
Log 10 Conversion
- Log 10 conversion node is simply used to convert any variables from the input file to the base of Log 10.
- Run this node and the converted variables will be available to the nodes connected downstream.
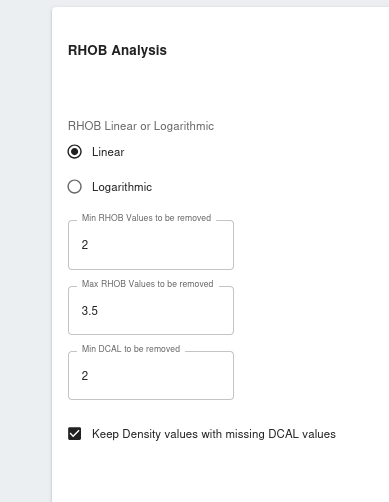
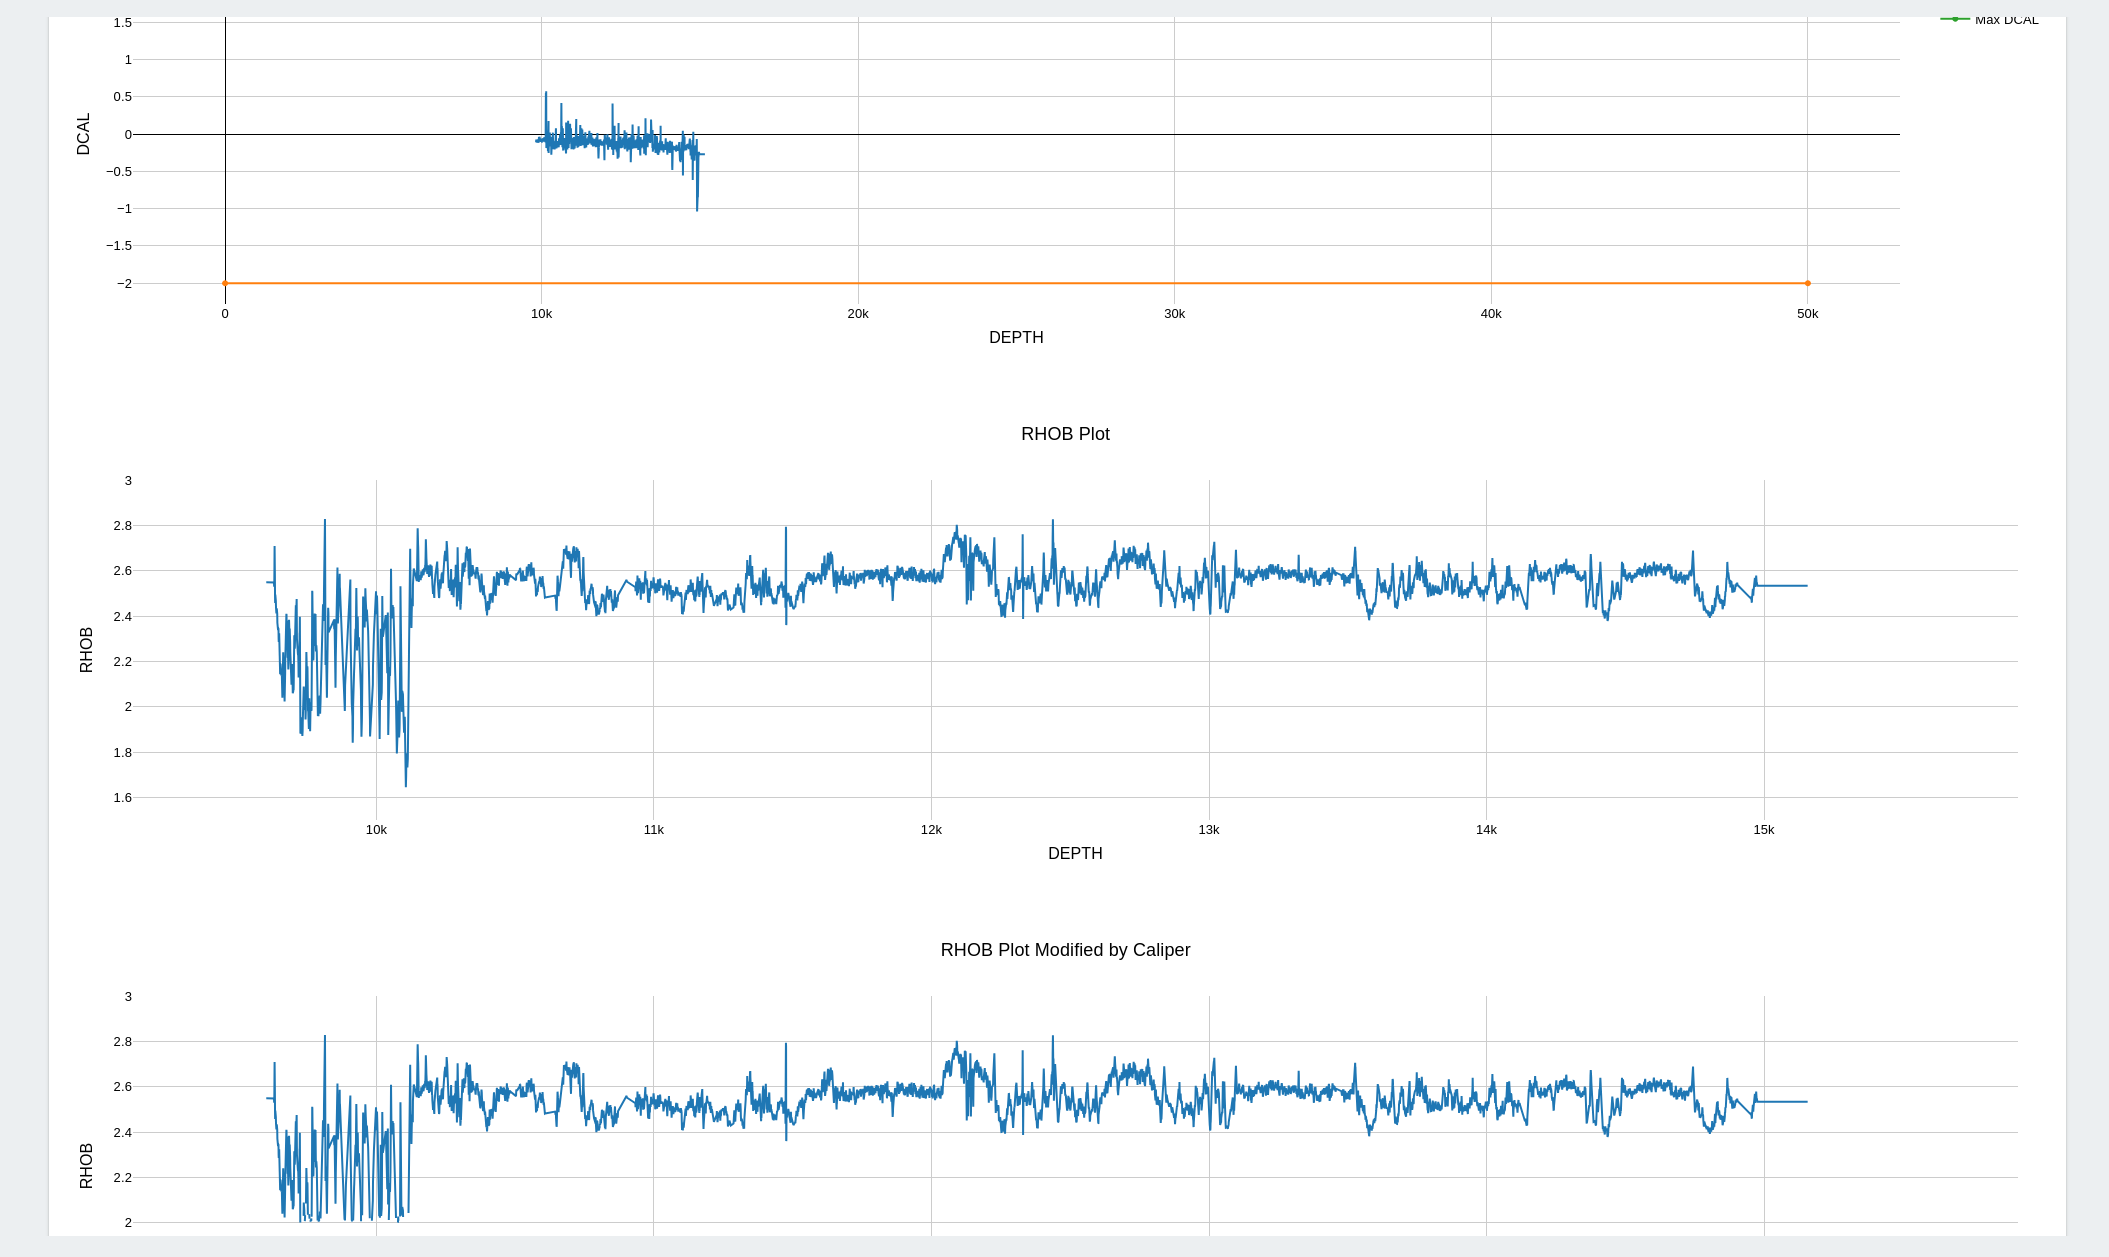
Density QC Node
- Once log 10 conversion node is ran, the files will be available for processing in the density QC Node
- Density QC Node is used to remove erroneous density or neutron logs based on the quality/values of the caliper variable(DCAL)
- Density and caliper logs are required to execute this node, please remove if these are not available
- Once the thresholds are set and the DCAL limits are set, the node can be executed and the results are available in the results section
- The results can be used as an input file in the next connected downstream node.
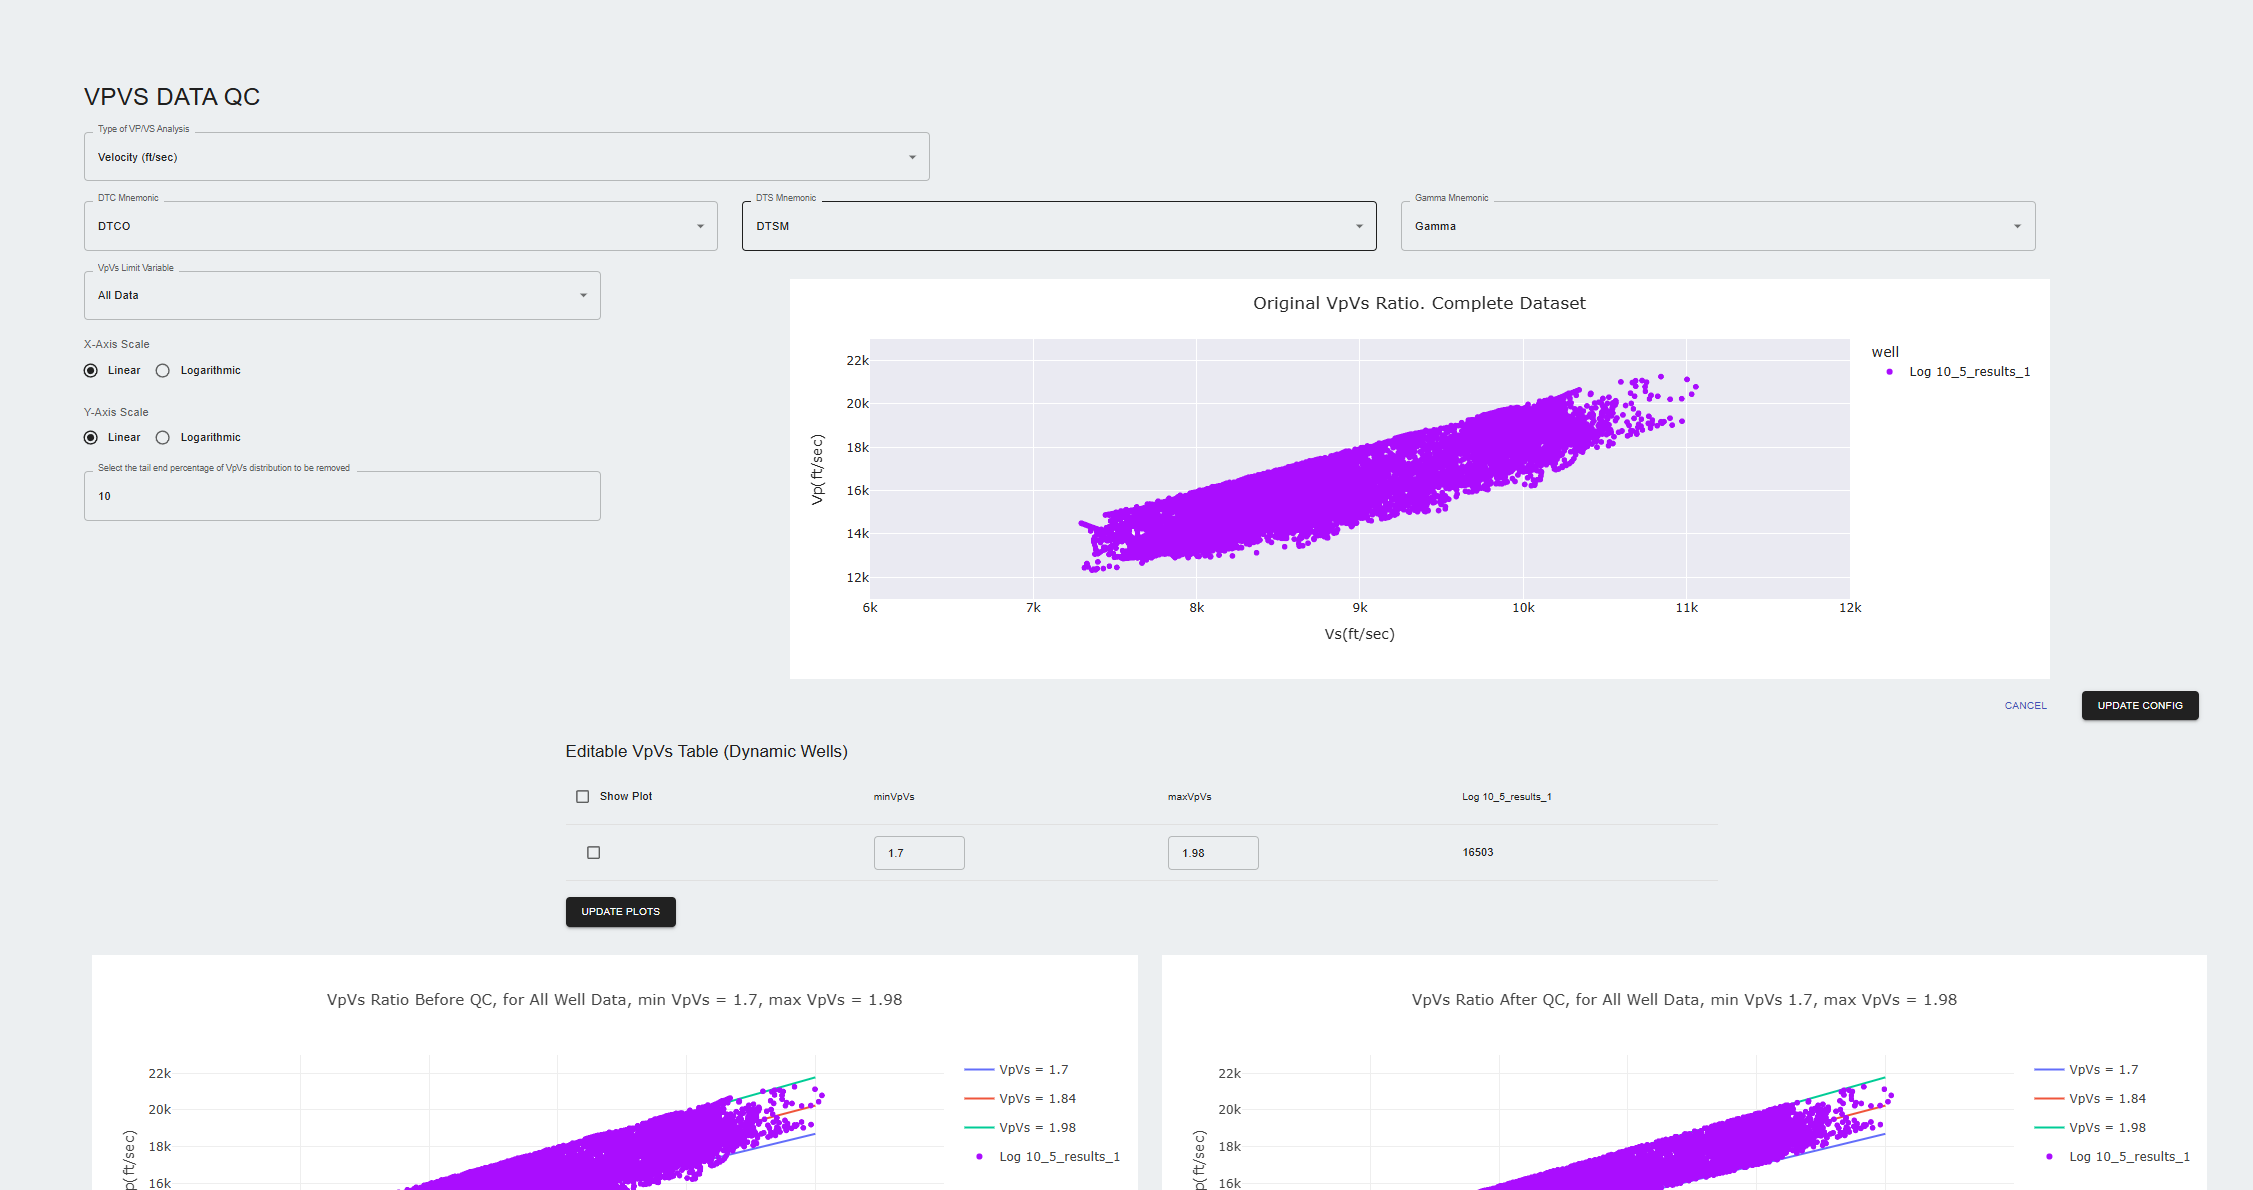
VpVs QC Node
- The VpVs QC Node is used to remove non-valid values for Vp and Vs.
- To configure the node, the data must have DTC and DTS logs.
- The node allows the users to visualize the Vp/Vs ratio through correlation plots.
- The user can set limits for the Vp and Vs logs to ensure the data contains valid ratios for VpVs.
- Run this node and the converted variables will be available to the nodes connected downstream.
Model Training
- Refer to basic QLog workflow for configuring model training.
- Multiple nodes are connected to the model training node as inputs
Property prediction
- Refer to basic QLog workflow for configuring property prediction.
- Users can attach wells that will be used for predictions as inputs to the property prediction node.
- The node can simulate testing or blind wells, as long as valid input variables are available to simulate the data.